Top Rated AppDynamics Alternatives
Video Reviews
374 out of 375 Total Reviews for AppDynamics
Overall Review Sentiment for AppDynamics
Log in to view review sentiment.
We can set the trimeframe inorder to use it for controller level dashboard and it's monitoring the application perfectly. Keeping an eye on the runtime and behaviour. It reduces MTTR too for better ticket process. Review collected by and hosted on G2.com.
Appdynamics admin portal is little slow and it's cost little higher for the usage. Server is also sometimes lag and shows error which slow down the process. Dashboard can be improved. Review collected by and hosted on G2.com.
1. Visualizes performance data in easily digestible charts.
2. Once-click metric exploration allows us to drill down into performance influences.
3. Zoom feature is great when you need to hone in on a specific time range of an incident. Review collected by and hosted on G2.com.
1. Some data gets lost on all functions.
2. User admin can be better.
3. Mobile App is poorly designed.
4. Costly Product Review collected by and hosted on G2.com.
It's very nice to see CISCO including new features and take more customers, using a "trojan" concpet in your customers to try AppDynamics LITE. Review collected by and hosted on G2.com.
I think like downside some positions and the hard way to install agents. It's very frustring when I see the competitors using one agent. Review collected by and hosted on G2.com.
AppDynamics is a great APM tool to monitor infrastructure, servers , database and APIs. It is easy to setup and use. Custom Dashboard, BRUM, Alerts , scheduling reports and related features help business and management in proactive monitoring to an extent. Transactions can be monitored easily and drilldown makes life easy in troubleshooting and resolving issues. Review collected by and hosted on G2.com.
License cost.
Business transaction detection sometimes takes a lot of time.
Limitations to monitor all technology applications. Review collected by and hosted on G2.com.
I am working as a Performance Engineer, and I use appdynamics for the application performance measurement . What I like about this tool is, It makes life easy when you have to capture server metrics. Plus easy to create a dashboard for essential metrics. Review collected by and hosted on G2.com.
The granularity of data points decreases if you don't take the metrics immediately after the test. Review collected by and hosted on G2.com.
Overall UI Experience is good.
1) APM Agent Installation.
2) Building and Integrating Custom Extensions.
3) Custom Dashboards.
4) Metric Browser for Trend review.
5) Analytics.
6) Organized Documentation
7) Microservices monitoring capability
8) AppDynamics APIs
9) Scheduling Reports.
10) Export Application. Review collected by and hosted on G2.com.
1) Controller Functional Errors & Bugs.
2) SLA for Support Ticket is not up to the mark for issue resolution.
3) Recent Agent monitoring issues. (Agent issues).
4) License cost vs Monitoring Capability.
5) Sometimes Need Customization for Monitoring applications (depending on framework)
6) AppDynamics Exceptions populate along with Application exceptions.
7) Business Transaction detections issues. (Same version of Agent works well in Non-Prod, while sometimes does not yield the same output in Production.)
8) Limitations to capture snapshots and Full call graphs during Application issues. Review collected by and hosted on G2.com.
Transaction snapshot drill down gives very detailed insight of the transaction that was slow or in error, the call graphs provide the quickest view of an transaction path with time taken at each node and time taken between nodes.
The upsides are baseline comparison against daily/weekly/monthly trends.
Custom dashboards caters the needs of all the teams across every level in our organization.
Violations and Anomalies section is much helpful to view all violations with severity and timeline when we have a major disruption Review collected by and hosted on G2.com.
AppD must colloborate with SAP and enable to monitor SAP Cloud Applications.
The downsides are sometimes AppD gave incorrect CPU utilization which then needed fine tuning.
It caused 15 minutes disruption to our business when the AppD machine agents were reconfigured during business hours.
During the troubleshooting underlying error showed more than 90% of the time consumed by AppD agent which was later corrected.
Real time user monitoring browser plugin for SAP cloud applications was causing other issues which prevented the SAP application to work as expected. Review collected by and hosted on G2.com.
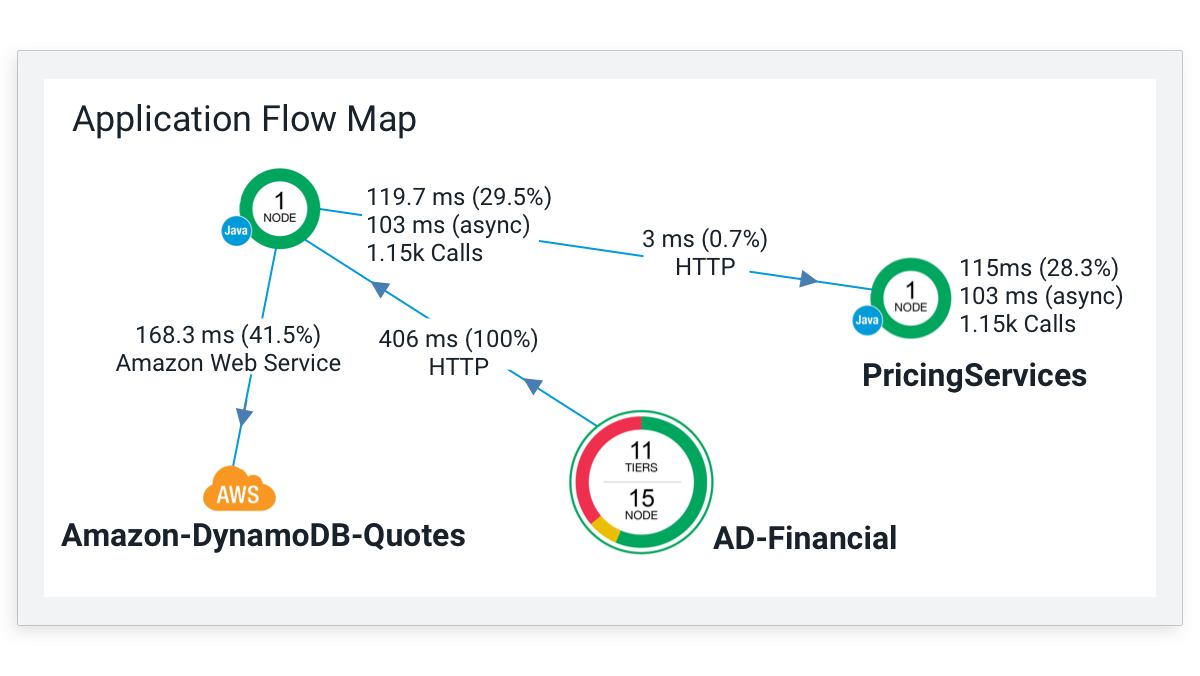
AppDynamics self discovery made it useful soon after installation. The Flowmaps is awesome. Review collected by and hosted on G2.com.
When configuring for multiple regions running identical software products, AppDynamics it time consuming (and boring) to configure all applications the same. This applies to dashboards, as well. Review collected by and hosted on G2.com.
Deep visibility in application performance with class/ method level visibility helping application and support teams reduce MTTR by more than 50% Review collected by and hosted on G2.com.
Log and network monitoring capabilities. Also, analytics has its limitations and cost is high Review collected by and hosted on G2.com.


