


Você pode interpretar dados de várias maneiras.
Isso ajuda você a entender conjuntos de dados e criar relatórios enquanto aplica múltiplos modelos estatísticos para fazer previsões.
Modelos estatísticos são uma representação matemática de dados observados que ajudam analistas e cientistas de dados a visualizar as relações e padrões entre conjuntos de dados. Além disso, eles fornecem uma base sólida para prever e projetar dados para o futuro previsível.
Em termos simples, modelos são relações entre duas variáveis. Por exemplo, o termo “modelar peso e tamanho do rato” significa estabelecer uma relação entre eles. Com o tamanho, o peso também aumenta. Aplicar modelagem estatística neste exemplo permite que você entenda a relação entre tamanho e peso, ajudando a analisar melhor os conjuntos de dados.
Este é um exemplo simples. As empresas usam software de análise estatística para realizar modelagem estatística complexa.
O que é modelagem estatística?
A modelagem estatística é um processo de aplicação de modelos estatísticos e suposições para gerar dados amostrais e fazer previsões do mundo real. Ela ajuda cientistas de dados a visualizar as relações entre variáveis aleatórias e interpretar estrategicamente conjuntos de dados.
A modelagem estatística ajuda a projetar dados para que não-analistas e outras partes interessadas possam basear suas decisões neles. Na modelagem estatística, cientistas de dados procuram padrões. Eles usam esses padrões como uma amostra e fazem previsões sobre o conjunto inteiro.
Existem três principais tipos de modelos estatísticos, incluindo:
- Paramétrico: Distribuições de probabilidade com um número finito de parâmetros
- Não-paramétrico: O número e a natureza dos parâmetros não são fixos, mas flexíveis
- Semi-paramétrico: Possuem componentes paramétricos e não-paramétricos
À medida que você implementa modelos estatísticos, comece a identificar os melhores modelos que se adequam ao seu propósito. Adotar esses modelos permitiria que você realizasse análises e gerasse melhores visualizações de dados.
Propósito da modelagem estatística
Modelos estatísticos ajudam a entender as características de dados conhecidos e estimar as propriedades de grandes populações com base neles. É a ideia central por trás do aprendizado de máquina.
Permite que você encontre uma barra de erro ou intervalo de confiança com base no tamanho da amostra e outros fatores. Por exemplo, uma estimativa X calculada a partir de 10 amostras teria um intervalo de confiança mais amplo do que uma estimativa Y calculada a partir de 10000 amostras.
A modelagem estatística também apoia o teste de hipóteses. Ela fornece evidências estatísticas para a ocorrência de eventos específicos.
Onde são usados os modelos estatísticos?
Modelos estatísticos são usados em ciência de dados, aprendizado de máquina, engenharia ou pesquisa operacional. Esses modelos têm várias aplicações no mundo real.
- Modelagem espacial trabalha com um sistema de informação geográfica (SIG) e estabelece uma relação entre processos e propriedades dentro de um espaço geográfico. Ajuda pesquisadores a entender e prever fenômenos do mundo real e planejar efetivamente.
- Análise de sobrevivência observa a duração do tempo em que uma série de eventos ocorre. Dependendo da área de estudo, a análise de sobrevivência também é conhecida como análise de confiabilidade, modelagem de duração ou análise de história de eventos. Esses modelos são usados para prever o tempo até o evento (TTE). Por exemplo, a análise de sobrevivência responde a perguntas como quanto tempo leva para disparar a primeira bala após comprar uma arma.
- Análise de séries temporais envolve a investigação de uma série de pontos de dados que ocorrem sucessivamente ao longo do tempo. Ela fornece insights sobre fatores que influenciam certos eventos de tempos em tempos.
- Sistemas de recomendação prevêem a escolha ou preferência de um usuário por um item e as classificações que eles provavelmente darão.
- Segmentação de mercado cria diferentes fragmentos de mercado com base nas necessidades, preferências e prioridades dos potenciais compradores. A modelagem estatística ajuda os profissionais de marketing a identificar segmentos de mercado relevantes para posicionar melhor seus produtos e focar em grupos-alvo.
- Aprendizado de regras de associação permite a descoberta de relações interessantes entre variáveis em grandes bancos de dados. É usado na detecção de ameaças, onde regras de associação permitem que especialistas em cibersegurança detectem fraudes.
- Modelagem preditiva ajuda pesquisadores a prever os resultados ou desfechos de um evento, independentemente de quando ele acontece. Esses modelos são frequentemente usados para prever o clima ou preços de ações, detectar crimes e identificar suspeitos.
- Modelos de pontuação são baseados em regressão logística e árvores de decisão. Investigadores os usam em combinação com múltiplos algoritmos para detectar fraudes com cartões de crédito.
- Agrupamento, ou um modelo de cluster, agrupa itens em um cluster de modo que haja mais semelhanças dentro do grupo do que outros itens em grupos diferentes.
Quer aprender mais sobre Software de Aprendizado de Máquina? Explore os produtos de Aprendizado de Máquina.
Modelagem estatística vs. modelagem matemática
Embora a modelagem estatística e a modelagem matemática ajudem profissionais a entender relações entre conjuntos de dados, elas não são a mesma coisa.
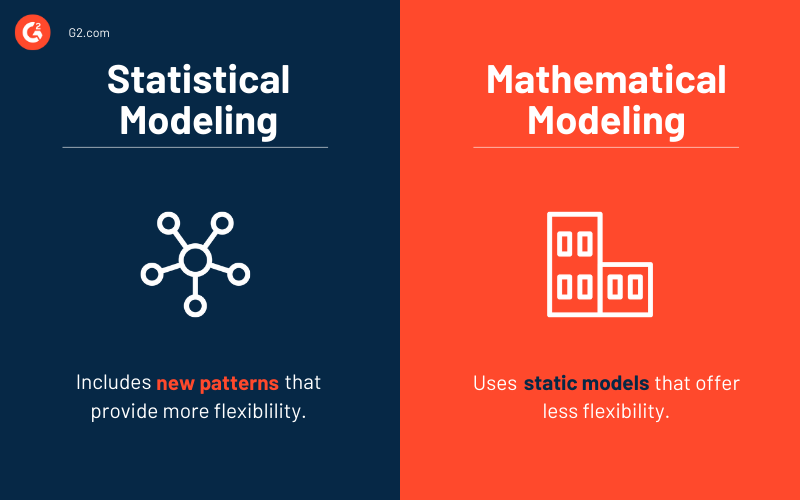
Modelagem matemática envolve transformar problemas do mundo real em modelos matemáticos que você pode analisar para obter insights. Ela usa modelos estáticos formulados a partir de situações do mundo real, tornando-a menos flexível.
Por outro lado, modelos estatísticos auxiliados por aprendizado de máquina são comparativamente mais flexíveis em incluir novos padrões e tendências.
Modelagem estatística vs. aprendizado de máquina
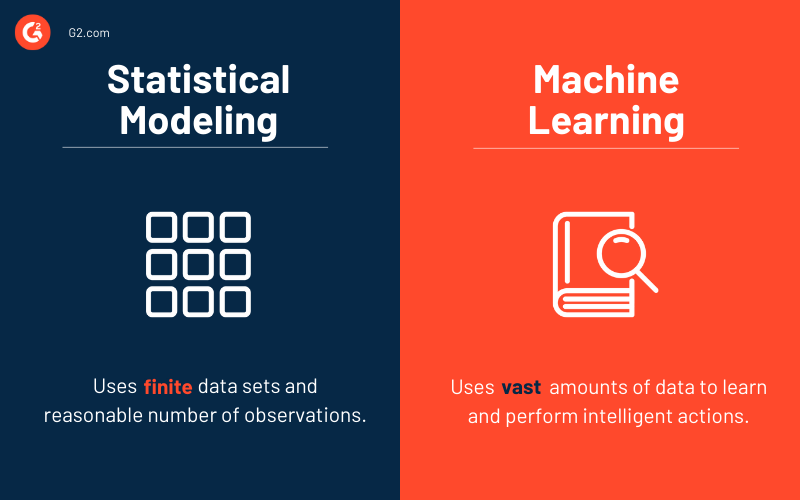
Modelagem estatística e aprendizado de máquina não são a mesma coisa. O aprendizado de máquina (ML) envolve o desenvolvimento de algoritmos de computador para transformar dados em ações inteligentes, e não depende de programação baseada em regras.
Antes de confiar em um resultado de análise estatística, todas as suposições precisam ser satisfeitas. Isso torna a tolerância à incerteza baixa. Ao contrário da análise estatística, os conceitos de aprendizado de máquina não dependem de suposições. Os modelos de ML são mais flexíveis.
Além disso, modelos estatísticos trabalham com conjuntos de dados finitos e um número razoável de observações. Aumentar os dados pode levar ao overfitting (quando modelos estatísticos se ajustam contra seus dados de treinamento). Por outro lado, modelos de aprendizado de máquina precisam de grandes quantidades de dados para aprender e realizar ações inteligentes.
Quando você deve usar modelagem estatística?
Você pode usar modelos estatísticos quando a maioria das suposições são satisfeitas ao construir o modelo e a incerteza é baixa.
Existem várias outras situações em que um modelo estatístico seria uma escolha apropriada:
- Quando o volume de dados não é muito grande
- Ao isolar os efeitos de um pequeno número de variáveis
- Erros e incertezas na predição são razoáveis
- Variáveis independentes têm menos e interações pré-especificadas
- Quando você requer alta interpretabilidade
Por exemplo, quando uma agência de marketing de conteúdo quer construir um modelo para rastrear a jornada de um público, eles provavelmente preferirão um modelo estatístico com 8-10 preditores. Aqui, a necessidade de interpretabilidade é maior do que a precisão das previsões, pois ajudaria a desenvolver uma estratégia de engajamento com base no conhecimento do domínio de negócios.
Quando você deve usar aprendizado de máquina?
Modelos de aprendizado de máquina são usados para analisar um grande volume de dados, e o resultado previsto não tem um componente aleatório. Por exemplo, no reconhecimento de padrões visuais, um objeto deve ser um ‘E’, não um ‘E’.
Existem vários outros cenários em que modelos de aprendizado de máquina seriam uma escolha melhor, incluindo:
- Treinamento de algoritmos de aprendizado em replicações infinitas de dados
- O objetivo final é obter previsões gerais e não relações entre variáveis
- Estimar incertezas em previsões não é essencial
- O efeito de qualquer variável não precisa ser isolado
- Baixa interpretabilidade não impacta sua análise
Por exemplo, quando sites de comércio eletrônico como a Amazon querem recomendar produtos com base em compras anteriores, eles precisam de um poderoso motor de recomendação. Aqui, a necessidade de precisão preditiva é mais importante do que a interpretabilidade do modelo, tornando o modelo de aprendizado de máquina uma escolha apropriada.
Técnicas de modelagem estatística
Os dados estão no centro da criação de um modelo estatístico. Você pode obter esses dados de uma planilha, armazém de dados ou um data lake. O conhecimento da estrutura e gestão de dados ajudaria você a buscar dados sem problemas. Você pode então analisá-los usando métodos comuns de análise de dados estatísticos categorizados como aprendizado supervisionado e aprendizado não supervisionado.
Técnicas de aprendizado supervisionado incluem:
- Um modelo de regressão: Usado para analisar a relação entre uma variável dependente e uma variável independente. É um modelo estatístico preditivo comum que analistas usam em previsões, modelagem de séries temporais e identificação de relações de efeito causal entre variáveis. Podem haver diferentes tipos de modelos de regressão, como regressão linear simples e regressão linear múltipla.
- Um modelo de classificação: Um algoritmo que analisa conjuntos de dados existentes, grandes e complexos para entendê-los e classificá-los de acordo. É um modelo de aprendizado de máquina que inclui árvores de decisão, vizinho mais próximo, floresta aleatória e redes neurais usadas em inteligência artificial.
As empresas também podem usar outras técnicas como métodos de reamostragem e métodos baseados em árvores na análise de dados estatísticos.
Técnicas de aprendizado não supervisionado incluem:
- Aprendizado por reforço: Um conceito de aprendizado profundo que itera e treina o algoritmo para aprender um processo ótimo recompensando resultados favoráveis e penalizando etapas que produzem resultados adversos
- Agrupamento K-means: Agrupa um número especificado de pontos de dados em clusters com base em certas semelhanças
- Agrupamento hierárquico: Ajuda a desenvolver uma hierarquia multinível de clusters criando uma árvore de clusters
Como construir modelos estatísticos
Ao construir um modelo estatístico, o primeiro passo é escolher o melhor modelo estatístico com base em seus requisitos.
Faça as seguintes perguntas para identificar seus requisitos:
- Você quer abordar uma consulta específica ou deseja fazer previsões a partir de um conjunto de variáveis?
- Qual é o número de variáveis explicativas e dependentes disponíveis?
- Como as variáveis dependentes estão relacionadas às variáveis explicativas?
- Qual é o número de variáveis que você precisa incluir no modelo?
Você pode escolher o melhor modelo para seu propósito uma vez que tenha respondido a todas as perguntas acima. Após selecionar o modelo estatístico, você pode começar com estatísticas descritivas e gráficos. Visualize os dados, pois isso ajudará você a reconhecer erros, entender variáveis e seu comportamento. Observe como variáveis relacionadas trabalham juntas construindo preditores e veja o resultado quando conjuntos de dados são combinados.
Você deve entender a relação entre potenciais preditores e sua correlação com os resultados. Mantenha o controle dos resultados com ou sem variáveis de controle. Você pode eliminar variáveis não significativas no início e manter todas as variáveis envolvidas no modelo.
Você pode manter as perguntas de pesquisa primárias em cheque enquanto entende as relações existentes entre variáveis, testando e categorizando cada potencial preditor.
As organizações podem aproveitar o software de modelagem estatística para coletar, organizar, examinar, interpretar e projetar dados. Este software vem com capacidades de visualização de dados, modelagem e mineração que ajudam a automatizar todo o processo.
Modele conjuntos de dados para prever tendências futuras
Empregue modelagem estatística para entender as relações entre conjuntos de dados e como mudanças neles afetariam outros. Após analisar essa relação, você pode entender o estado atual e fazer previsões futuras.
Com a modelagem estatística adequada, você pode interpretar a relação entre variáveis e aproveitar os insights para prever variáveis que você mudaria ou influenciaria para obter o resultado esperado no futuro.
Saiba mais sobre análise estatística e encontre melhores maneiras de tomar decisões de negócios usando dados presentes.

Sagar Joshi
Sagar Joshi is a former content marketing specialist at G2 in India. He is an engineer with a keen interest in data analytics and cybersecurity. He writes about topics related to them. You can find him reading books, learning a new language, or playing pool in his free time.

