Whether your business is about software or skydiving, charting your tasks can be exciting and challenging.
There's only so much time in a day. You have to spend those valuable hours as efficiently and productively as possible. One of the easiest ways you can do this is by using Gantt charts. Gantt charts make managing projects and processes much easier. They can help you and your team eliminate wasted effort and be as productive as possible.
Many businesses use mind mapping software to create Gantt charts to manage projects and processes.
What is a Gantt chart?
Gantt charts are bar charts that show a project schedule's start and end dates. It breaks down the project’s individual tasks, along with each task’s deadline. These colorful charts are a popular project management tool because they make scheduling and completing project tasks easy to visualize. They also help communicate with non-project team members and check against the logical order of work.
Gantt charts are used in business and project management to illustrate scheduled events in the form of bars. They are named after their inventor, Henry Gantt, and were widely used during World War I for coordination between government, military, industrial enterprises, and defense contractors.
Gantt charts visually depict project data as stacked horizontal bars. One bar shows when each task or project begins in relation to the others. This means that you can easily see what tasks have been accomplished or when there's not enough time to complete any unrelated projects and tasks. It's easier to see how progress happens daily, weekly, and monthly. This makes it easy to eliminate wasted time and effort.
Gantt charts can be created using software or a marker on a whiteboard. Project managers and team members alike utilize them to view a project schedule's start dates, end dates, and milestones in a visual format.
Key terms for understanding Gantt charts
- Milestones: A milestone is an important date or event in a project; for example, a milestone could be the completion date of the project's first phase.
- Work breakdown structure (WBS): A WBS splits project tasks into manageable pieces based on the workforce required. Determining this is a critical part of a project because a proper breakdown structure makes the job easier to handle.
- Critical path: The critical path technique involves several actions in a project plan that team members must complete, so the project meets its final deadline. If one vital task is skipped, the entire project could be delayed. With critical path management software, you can determine which actions to focus on to complete a project on time.
Why use a Gantt chart?
A Gantt chart is effective because it introduces visual task management, an approach to organizing tasks. You can monitor your task using a simple graphical interface rather than depending on hundreds of to-do lists or managing due dates across worksheets, file folders, and inboxes.
Gantt charts are straightforward because they are graphical – they enable users to see everything clearly in one place, serving as a touchstone for the team.
Gantt charts can help save time since they are so simple. They lessen the amount of hours employees spend looking for answers or following up with teammates to inquire about the progress of a job and whether they require anything to continue working. When done correctly, a Gantt chart can streamline even the most complex project.
Here's a quick breakdown of the details a Gantt chart offers you:
- The ways a project is divided into tasks
- The start and end times for each task
- Time duration for each task
- Owner of each task
- How activities relate to each other
- Deadlines for critical meetings and approvals
- A project's progress
- The whole project timeline from beginning to end
Quer aprender mais sobre Software de Gestão de Projetos? Explore os produtos de Gestão de Projetos.
History of Gantt charts
In 1896, Karol Adamiecki, a Polish mechanical engineer and teacher, designed what would become the first Gantt chart. To improve productivity, he created the law of harmony in administration, highlighting the necessity of effective teams, scheduling, and suitable production. He invented the harmonogram, which was a forerunner to the Gantt chart. It wasn't released until 1931 and was only available in Polish.
By 1917, American engineer Henry L. Gantt drew inspiration for his own chart from Adamiecki's harmonogram. The Gantt chart became a method of describing resource loading and production management in industries. It was also crucial in assessing staff productivity.
Gantt charts were first built using tangible items such as paper and blocks. Some of the first were employed at arms manufacturing facilities during World War I to oversee the extraordinary production goals to aid war efforts effectively.
Gantt charts were simply hand-drawn until the 1980s. The introduction of computing technology opened the door to more complicated Gantt charts. They also became easier to adapt and alter as needed. Nowadays, Gantt charts are frequently used with mind mapping tools or project management software.
What is a Gantt chart used for?
Gantt charts aid in visualizing the progress of numerous activities and projects that occur concurrently within a company. Modern teams use them to plan and organize projects to optimize the deployment of resources and complete priority initiatives before starting less significant tasks. This is vital information to have while managing projects for several reasons:
- Progress tracking: Project managers can monitor each task completion and adjust the project timeline accordingly. The charts also highlight which targets are fulfilled on time, which helps identify strengths and weaknesses in staff productivity.
- Project planning: Managers can assign deadlines, milestones, and timetables to different project sections.
- Resource administration: Project managers can synchronize resource allocation with the project timetable. They can observe how much time each procedure requires and allocate resources accordingly.
Gantt charts work on their own, but they can also play well with others. They’re a great teammate to the waterfall project management methodology, where customer expectations are collected at the start of a project. A linear plan is constructed to satisfy them as they linearly depict project information and each step is dependent on the previous task. This can be clearly shown in Gantt charts.
Agile project teams create their own objectives and use constant customer input to revise their plans in real time. In agile project management, Gantt charts can help compare an old plan to a new amendment and determine the impact of the change on the overarching strategy.
When is a Gantt chart appropriate?
How can you tell whether a Gantt chart is appropriate for managing projects? A Gantt chart is helpful for any project that has a plan! However, there are a few telltale signals that you'll require a Gantt chart to finish the work.
Use a Gantt chart if:
- There's a tight deadline for your project.
- The project involves several individuals or teams who must work together.
- A manager, customer, or team member requires a visual roadmap of the project's progress from start to finish.
- Your project has some sophistication to it, such as activities that employees must complete in a defined sequence.
- You have to manage your team's workloads as they work on several projects simultaneously.
- You've got a fair concept of how long each activity should or could take.
Components of a Gantt chart
Interpreting a Gantt chart boils down to understanding how the various components come together to make it function. To be deemed a Gantt chart, it must feature a task list with bars representing each task's start and finish dates. However, most successful project managers expand on the capability of a Gantt chart by integrating additional components.
Here are the main components of a Gantt chart and how they work in a project plan:
Dates
The dates are one of the essential components of a Gantt chart since they indicate to project teams when the project begins and concludes, as well as when each task needs to occur. The dates are clearly visible on most Gantt charts, and most stakeholders' eyes soon drift to the top of the chart, where the deadlines live.
Tasks
The first step in project management is to break down a project into individual tasks. Large projects almost always have a multitude of subtasks. The task list is known as a WBS in project management jargon. A Gantt chart supports project managers by keeping track of all subtasks in a plan so that nothing is overlooked. The tasks are displayed on the left side of the page.
Project managers have to be careful because if the tasks are tiny, ineffective micromanagement is a risk. If the tasks are too large, teams lose the benefit of project control. Each task should preferably take between 8 and 80 hours to complete.
Bars
Bars represent the time period allotted to accomplish each task. This ensures that each subtask is finished on time, which allows the overall project to finish on time. These are horizontally displayed on the right side of the Gantt chart and indicate progress, duration, and start and finish dates.
Milestones
Milestones are activities that are critical to the completion and success of a project. Unlike simple details that must be fulfilled, reaching a milestone provides a sense of accomplishment and forward momentum.
Milestones are represented on a Gantt chart as diamonds (or other shapes) at the end of a certain taskbar. Milestones can also mean major events, deadlines, decisions, and deliverables.
Dependencies
In an ideal world, all project tasks are interdependent. While some activities can be accomplished at any time, others must be executed before or after the start or completion of another subtask. For example, you don’t begin a wedding reception before the wedding vows.
Indeed, this exemplifies the most prevalent sort of task reliance: one task cannot start until the previous task is completed. This is known as dependency.
Dependencies are of four types:
- Finish to Start (FS): Task B cannot begin until Task A is completed. This is the most typical.
- Finish to Finish (FF): Task B cannot be completed until Task A is completed.
- Start to Start (SS): Task B cannot begin until Task A has begun.
- Start to Finish (SF): Task B cannot be completed until Task A begins. This one is very rare.
Task dependencies are depicted as an arrow from one task to the next on the Gantt chart.
Vertical line marker
A vertical line marker describes the current date on the chart, which is another approach to tracking the project's progress. It allows you to efficiently manage your time since you can see at a glance how much work remains and whether you are on schedule to deliver the project on time.
Task ID
In today's highly competitive business environment, you're undoubtedly tackling multiple roles at once. Including the task ID on the Gantt chart allows everyone involved to readily identify the most relevant task.
Resources
Not every Gantt chart includes the name of task owners. But if your project involves a group of individuals, including their names and their responsibilities can be highly beneficial. Identifying and allocating resources allows supervisors to manage employees, tools, and talents more efficiently.
Gantt chart example
A Gantt chart supports you in developing, executing, and controlling your business strategies. This is an example of how Gantt charts could help you make a winning search engine optimization (SEO) campaign.
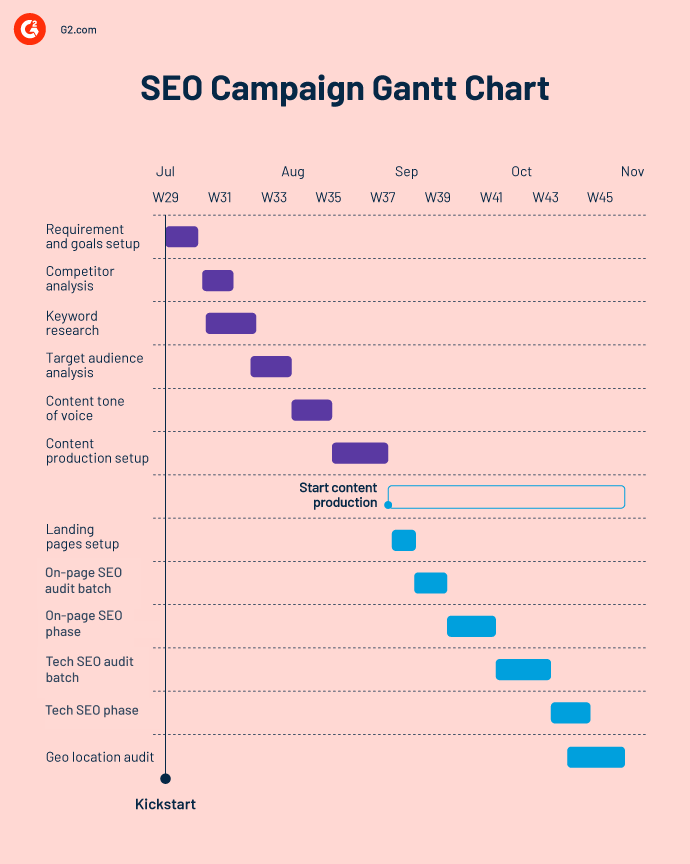
An SEO campaign is a well-planned attempt to increase the SEO rankings of a page or website. A simple Gantt chart can help SEO teams:
- Assign work and establish deadlines
- Set dependencies and milestones
- Track progress
- Engage in team activities
An SEO campaign involves a lot of variables. A business must allocate resources effectively to meet the needs of its SEO strategy. Gantt charts support users by breaking down large projects into smaller parts to delegate tasks and share responsibilities.
An SEO project plan can also be used as a benchmark for evaluating results. The plan's milestones and goals will show you whether you're on track and what areas require additional attention. The tools that Gantt charts use provide you with everything you need to plan like an expert.
With Gantt chart software, you can easily create timelines for your SEO efforts, track task progress, manage dependencies, and execute campaigns.
Tip: There are plenty of great resources out there to help you get started. Template Lab provides 36 Free Gantt Chart Templates in Word, Microsoft, and Excel.
One of the most significant advantages of Gantt charts is that they can break down a big project into small chunks of work known as tasks. This allows those working on a campaign to gain a more precise visual understanding of timelines.
This helps collaborators comprehend dependent tasks and how any change affects overall development. For example, teams can break down the entire SEO research into tasks such as competitor analysis, keyword research, and audience analysis to attract the correct audience.
Since Gantt charts show the percentage completion of each activity, team members understand how to arrange their strategy and focus. Both managers and team members can use this to measure progress and highlight both missteps and achievements. High-performing team members can leverage this information to demonstrate accountability or offer help to colleagues who are struggling.
Auditing, on-page optimization, and content generation are critical components of any SEO effort. These significant moments can be thought of as milestones that allow others to quickly identify important dates and cross them off as they are completed.
How to make a Gantt chart
Project management systems that integrate Gantt charts offer leaders better insight into team workloads and potential availability, enabling more precise scheduling. While no two Gantt charts are identical, there are certain basic procedures you need to execute regardless of the technology you select.
- Examine the project's scope. Gather your team to decide on the project scope. Discuss the objectives you want to achieve now and the goals you want to save for the future. How will the work be divided among team members? What are the major dependencies? Which resources will you need to reach your objectives?
- Establish a time range. Consider your Gantt chart to be a representation of your project on a timeline. While all tasks have a clear endpoint, you may have some follow-up responsibilities with your client after finishing the project. You might need to include some post-facto deadlines for these activities.
- Add tasks with deadlines. To correctly display your task list, make sure each task has a defined start and finish date so they can be clearly seen on a bar chart. If you don't provide task start and end dates, your tasks will appear as points in time, which is difficult to see in the context of the overall vision. Clearly defined start and finish dates help your team understand when they should start working on a task. That way, they won't be caught off guard by a major assignment due the next day.
- Identify dependencies. It's natural in big projects to have certain activities that can't begin until other tasks have been completed. Display dependencies among tasks in your Gantt chart to keep the project operating smoothly.
- Set milestones. Milestones are fixed points in time. Consider them as checkpoints to indicate the completion of major portions of the project. Milestones are frequently near the conclusion of project phases, but there is no one method to set milestones for your team, especially because every team and project is unique.
- Update tasks as plans change. Plans undoubtedly shift, which is why your Gantt chart should be able to adapt to your demands. Look for a system that allows you to drag and drop tasks and dynamically alter dependencies in real time. This way, you can always keep your projects on track, even when the unexpected happens.
Making a Gantt chart in Excel
The bar chart function in Microsoft Excel helps create a Gantt chart.
- Step 1: Create an Excel table with your project schedule. Enter each task as a unique row in your project plan. Provide the start, end, and duration deadlines.
- Step 2: Create a standard bar chart with start dates.
- Step 3: Include the duration of your tasks.
- Step 4: Fill in the task descriptions in the Gantt chart.
- Step 5: Use formatting to convert the bar graph into an Excel Gantt chart.
You can also accomplish this with Microsoft PowerPoint, which is great for presentations. A Gantt chart template for Excel is available for download from Microsoft.
How to use a Gantt chart
Getting started with Gantt charts is easy. The three most typical uses for this type of chart are:
- Developing a marketing strategy: Larger marketing efforts need excellent coordination and collaboration, but keeping track of all the moving components is challenging. Therefore, it's critical to visualize your work as a series of tasks with assignees and time estimates for each effort. This way, teams recognize who is accountable for what and how their action affects others and the overall goal.
- Outlining client deliverables: When you provide clients with a schedule of all your deliverables, you set clear expectations for how long each task will take. By establishing these parameters, you can provide customers and stakeholders with a clear understanding of the breadth and duration of your deliverables.
- Organizing a product launch: You can use a roadmap to lay out the whole strategy for a product launch, from ideation through launch and beyond. Teams can more readily see challenges before they start, understand dependencies between phases, and understand all that's happening by visualizing everything on a timeline.
- Developing a marketing strategy: Larger marketing efforts need excellent coordination and collaboration, but keeping track of all the moving components is challenging. Therefore, it's critical to visualize your work as a series of tasks with assignees and time estimates for each effort. This way, teams recognize who is accountable for what and how their action affects others and the overall goal.
Benefits of Gantt charts
A fundamental advantage of a Gantt chart is its capacity to provide a top-line view of a project. It gives managers and workers a high-level overview of the essential project tasks and their deadlines. The chart allows you to track the project's progress by displaying how tasks are related.
Here are some of the primary advantages of using Gantt charts:
- Boost efficiency and aid in resource management. Gantt charts support project managers in determining achievable project deadlines and setting targets based on available resources. Both of these benefits boost productivity.
- Promote teamwork and productivity. Teammates have access to the same information, which keeps everyone up to date on the project's status. As a result, all team members, including remote employees, can be held responsible for their tasks. Team members can use the chart to define roles and responsibilities.
- Support better tracking. Project leaders and team members can use Gantt charts to assess workflows for limitations and modify their efforts accordingly. Gantt charts help project managers keep track of milestones and tasks throughout the project. Team members can quickly see which elements of the Gantt chart are missing.
- Manage several projects. Gantt charts empower teams that are trying to juggle. It’s easier for supervisors to evaluate which resources are essential at what times and to make appropriate adjustments.
Limitations of Gantt charts
Gantt charts aren't without flaws. One of the biggest issues with employing Gantt charts in large projects is their complexity. The charts could also fail to accurately portray the intricacies of some tasks and the time your team needs to complete them.
Here are some of the most common problems with Gantt charts:
- Not much info on task dependencies. Gantt charts make room for dependencies, but only on a superficial level inside specific project tasks. To make up for this, a project team might employ a program evaluation review technique (PERT) chart alongside a Gantt chart. A PERT chart includes arrows highlighting the order in which team members must finish specific tasks before moving on to the next.
- Lack of specificity. Gantt charts help present a high-level overview of ongoing projects. They can, however, leave certain things open to interpretation. This is especially true regarding large-scale IT projects like DevOps. Specific information concerning objectives, dates, and expectations is often overlooked.
- Taskbars don't display the volume of labor for each task. The length of a Gantt chart task bar indicates how long it can take to complete a work, but the duration doesn’t represent the exact resources necessary for such a task. Some tasks with small bars may need substantial resources while some tasks with long bars may use few resources. The Gantt chart is deceptive when it comes to expressing the quantity of labor and resources necessary. As a result, various tools along with the Gantt chart are needed to allocate and manage resources accurately.
Best practices
There are a few easy principles to follow if you want to create a Gantt chart that everyone can use and explore. Follow these tips and best practices to create a nice Gantt chart that is simple to update and manage.
- Get granular with your tasks. The more thorough you can be with tasks, the easier it is to track progress and processes leading up to deliverables. Review your work breakdown structure and identify your actions to develop it.
- Sort tasks into groups or stages. Forming task groups makes your plan simpler to review and comprehend. It also enables your team and stakeholders to identify tasks related to a deliverable or a phase.
- Never allocate tasks without first confirming team availability. If you're lucky enough to have a solution that displays complete team availability, make use of it! Knowing how busy your team is and what projects they're involved in helps you deliver work on time and boost team spirit. Knowing your team's general availability allows you to adapt your strategy to match the demands of current project work or change the milestones you've set.
Visualize your success
Visualizing your project plan is a crucial step for every team. Gantt charts are beneficial because they provide teams with a visual depiction of where their work may overlap, assisting your team in planning projects and prioritizing tasks.
Unable to manage your tasks? Use task management software to supervise individual tasks and organize your team’s daily workflow.

Keerthi Rangan
Keerthi Rangan is a Senior SEO Specialist with a sharp focus on the IT management software market. Formerly a Content Marketing Specialist at G2, Keerthi crafts content that not only simplifies complex IT concepts but also guides organizations toward transformative software solutions. With a background in Python development, she brings a unique blend of technical expertise and strategic insight to her work. Her interests span network automation, blockchain, infrastructure as code (IaC), SaaS, and beyond—always exploring how technology reshapes businesses and how people work. Keerthi’s approach is thoughtful and driven by a quiet curiosity, always seeking the deeper connections between technology, strategy, and growth.


