


Seja subconscientemente ou de propósito, é da natureza humana colocar coisas em grupos.
Talvez você organize seu armário com base na cor ou seus copos de acordo com o tamanho. Você pode até agrupar seus amigos com base em quem você pode chamar em caso de emergência.
Seja qual for o caso, você está fazendo sua própria análise de coorte sem nem perceber, organizando seus itens pessoais em grupos, também chamados de coortes.
O que é análise de coorte?
A análise de coorte é o processo de usar análises comportamentais e dados de várias plataformas ou aplicativos web, e dividir os dados em grupos para exame adicional. Esses grupos, ou coortes, geralmente compartilham características específicas ao longo de um período de tempo.
No mundo dos negócios, a análise de coorte pode ser uma das maneiras mais eficazes de reunir informações sobre o comportamento do cliente e como eles interagem com seu produto ou serviço, independentemente do seu setor. É mais fácil falar do que fazer, e muito se investe para garantir que você está fazendo uma análise de coorte da maneira certa.
Coortes vs. segmentos
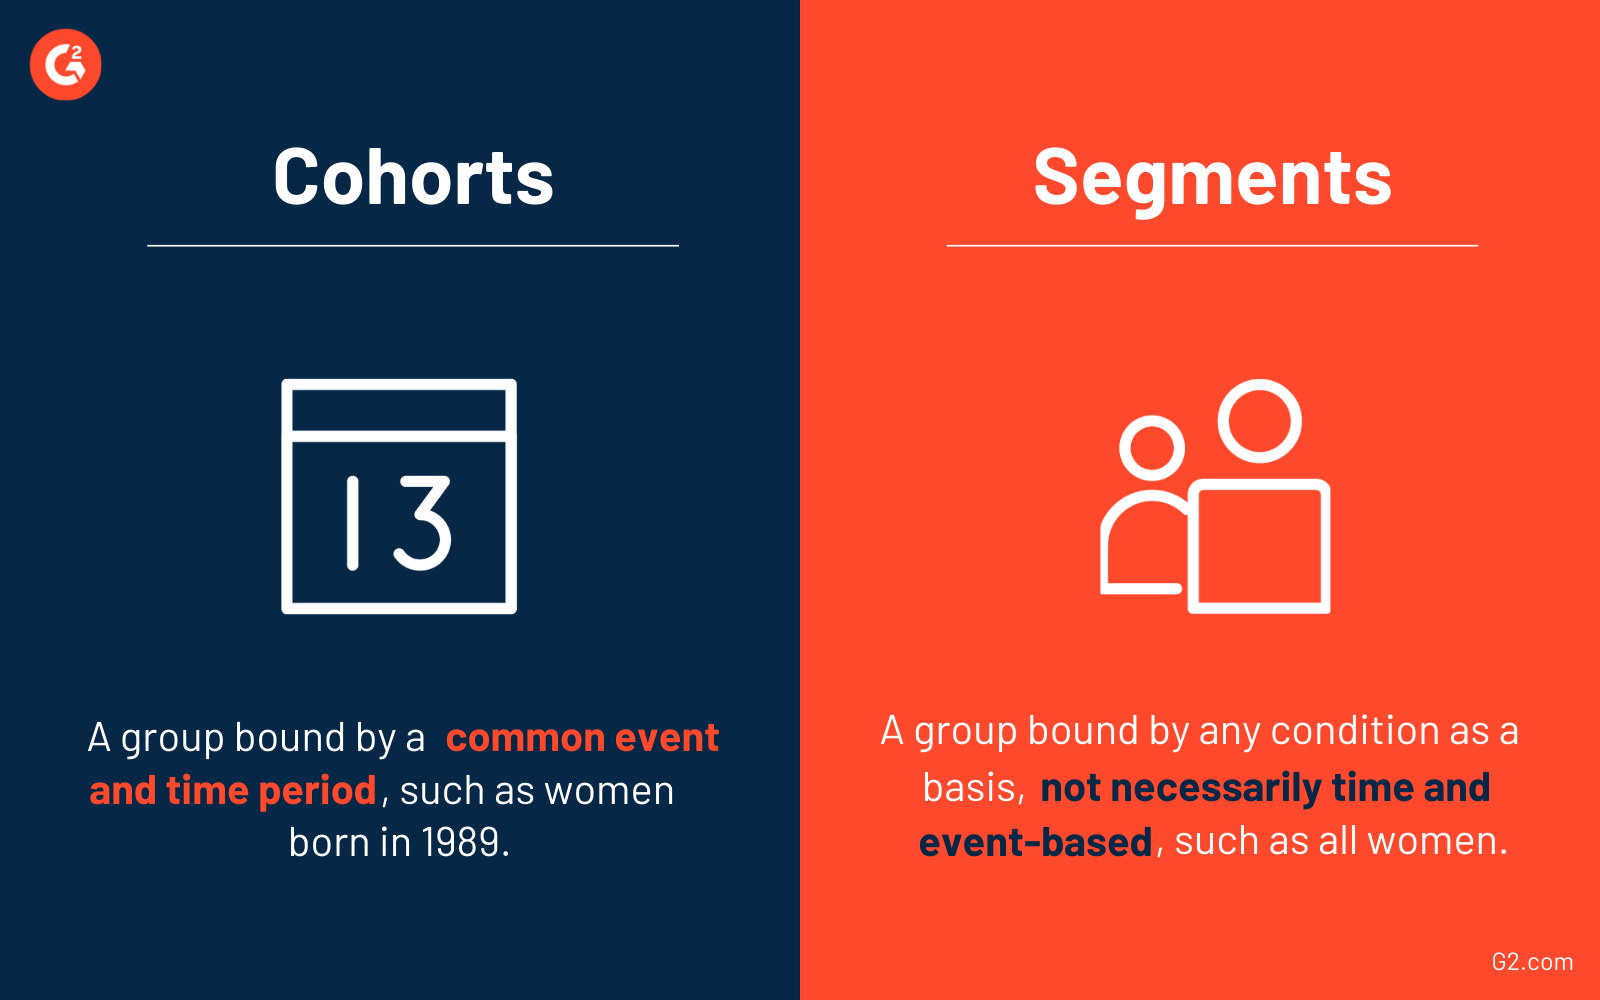
É comum ver os termos coortes e segmentos usados de forma intercambiável ao se aprofundar na análise comportamental. Isso não está correto, pois os dois termos não são os mesmos.
Para que um grupo de usuários seja considerado uma coorte, eles devem estar vinculados por um evento comum e um período de tempo. Isso seria mulheres que nasceram em 1989 ou graduados em 2011 com especialização em negócios.
No entanto, um segmento de usuários pode ser criado com quase qualquer condição como base. Não precisa ser baseado em tempo e evento, como mulheres ou todos os graduados.
Quer aprender mais sobre Plataformas de Análise? Explore os produtos de Plataformas de Análise.
O que a análise de coorte faz?
Quando se trata de análise de negócios, é comum comparar coortes e analisar o comportamento de uma única coorte como uma forma de identificar padrões.
Realizar uma análise de coorte pode responder a perguntas como:
- Quando os usuários começam a abandonar?
- Quão valiosas são suas coortes?
- As novas coortes são mais ou menos valiosas do que as anteriores?
- Qual é a taxa de retenção dos seus usuários?
- Qual é o valor a longo prazo dos seus usuários?
Quando você verifica o desempenho de uma determinada coorte, há uma ampla gama de métricas que podem ajudá-lo. Por exemplo, elas podem ajudá-lo a identificar problemas mais cedo, como a taxa de abandono de clientes. Verificar cada coorte também pode desenvolver previsões de negócios mais precisas, o que permite mais informações sobre comportamentos sazonais, melhor planejamento estratégico e um plano de marketing totalmente desenvolvido.
Como realizar uma análise de coorte
Existem quatro etapas principais para realizar uma análise de coorte.
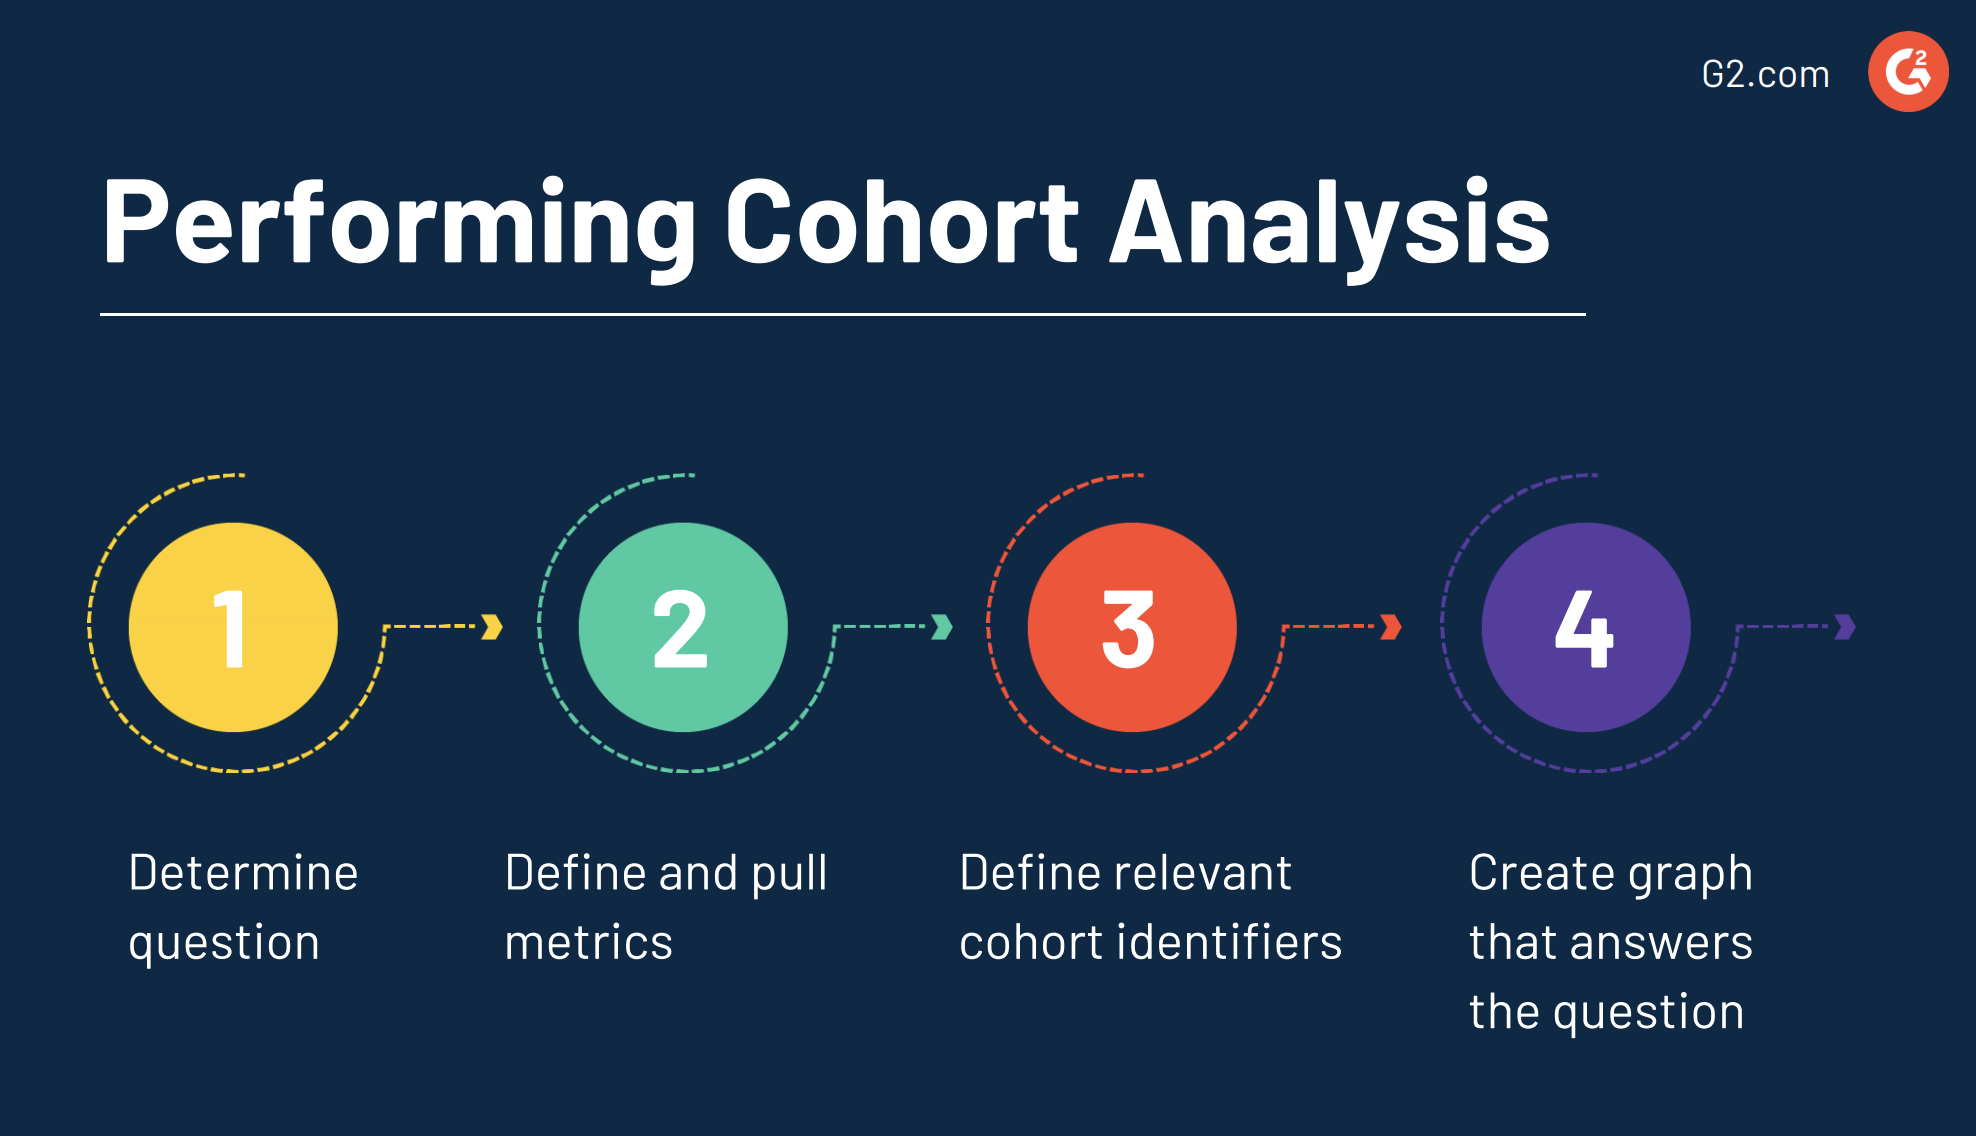
Primeiro de tudo, você precisa determinar a pergunta que deseja responder. O objetivo de realizar uma análise de coorte é ter algum tipo de informação acionável no final. Essa informação levaria seu negócio a melhorar seu produto ou serviço, ou melhorar a experiência do usuário e a taxa de rotatividade.
Em seguida, reduza as métricas que o ajudarão a responder a essa pergunta. Seja saber quando um usuário para de interagir com seu aplicativo ou qual é sua transação total média, é vital ter essas métricas antes de seguir em frente.
Depois disso, defina suas coortes. Ou você vai analisar todas as suas coortes e direcioná-las da mesma forma, ou vai agrupá-las com base nas diferenças e semelhanças entre cada uma delas. Independentemente da rota que você escolher, o objetivo é descobrir e explicar o comportamento como uma coorte individual.
Finalmente, você realizará a análise usando visualização de dados, o que permitirá que você veja os resultados em um gráfico organizado que o ajudará a responder à sua pergunta original.
Gráfico de análise de coorte
À primeira vista, gráficos de coorte são intimidantes e não são os mais fáceis de ler. Este tipo de visualização de dados reúne muitas informações em um só lugar.
Abaixo está um exemplo de um gráfico de análise de coorte que traça a receita semanal por grupo. Neste gráfico, as coortes são definidas como clientes adquiridos em uma semana específica, começando na segunda semana de janeiro.
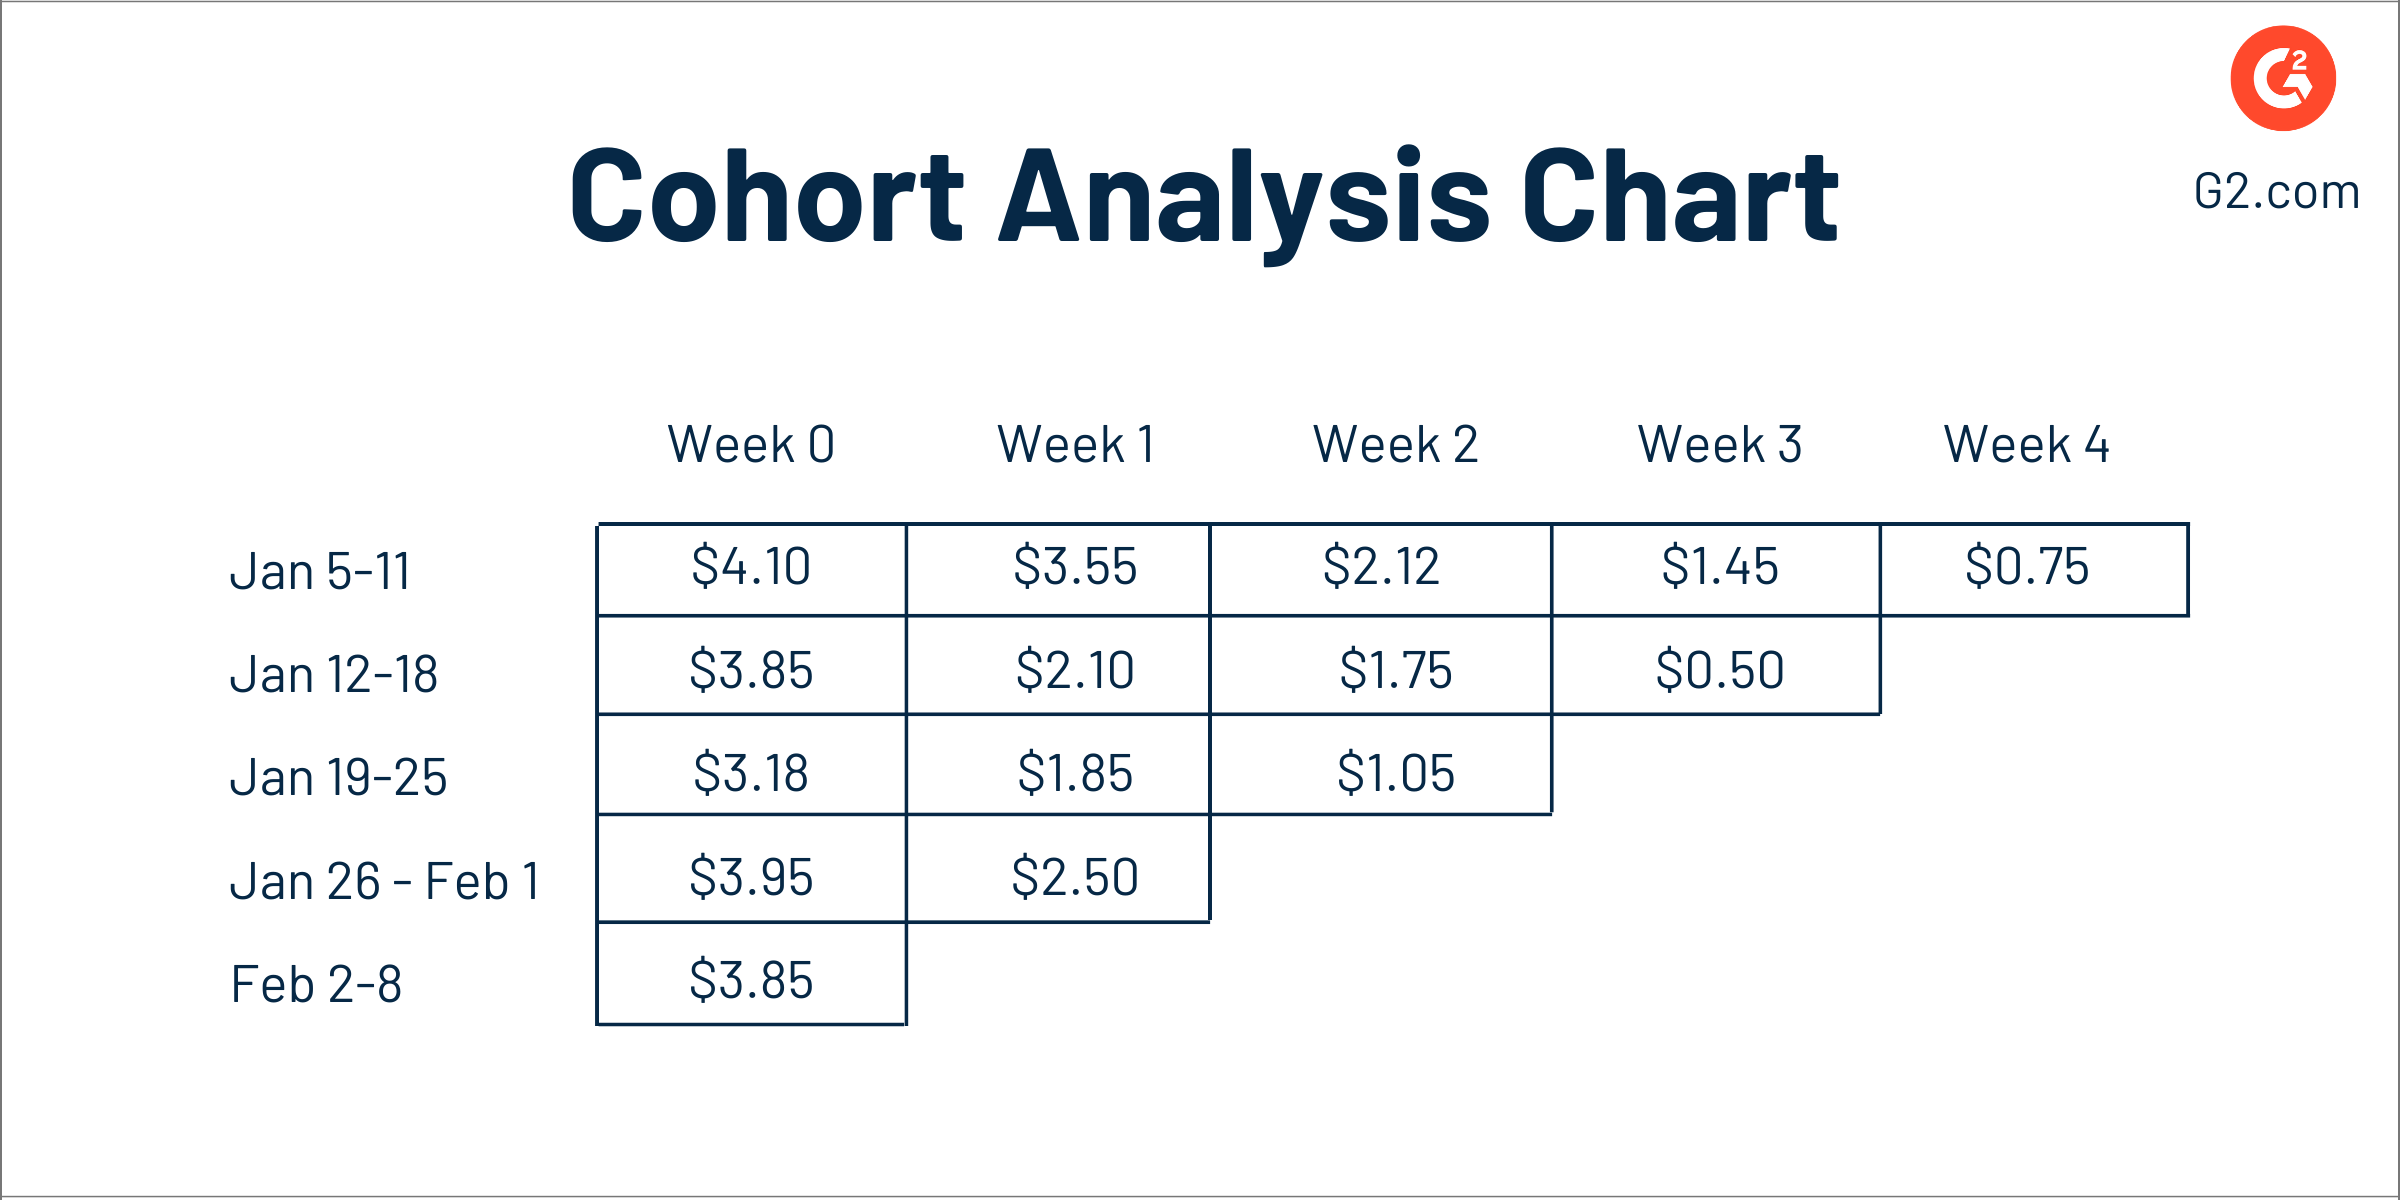
As coortes correm em um eixo vertical, com as coortes mais antigas no topo e as mais novas na parte inferior. Este exemplo mostra coortes semanais com a semana mais antiga começando em 5 de janeiro. Ao longo do eixo horizontal, você verá os períodos de tempo desde o início da coorte. Esses dados começam na semana 0 e vão até a semana 4.
Os dados no meio são onde você pode ver a receita gasta por grupo. As coortes mais antigas, ou clientes, têm mais tempo com sua empresa e, portanto, têm mais dados.
Para visualizar melhor as tendências nos dados, a maioria dos gráficos de coorte utiliza sombreamento de cores. Quando olhamos novamente para os dados, mas com células coordenadas por cores, você verá que quanto mais escura a cor, maior é a receita por usuário.

A diferença de cor entre as células também facilita ver quando o valor decai ao longo do tempo, então, neste caso, podemos ver que os usuários gastam mais dinheiro na primeira semana do que em qualquer outra semana. Você também pode ver anomalias nos dados, como o início baixo durante a semana de 19 de janeiro.
RELACIONADO: Para poder ler um gráfico de análise de coorte, você primeiro precisa do software de visualização de dados certo que possa criá-lo para você. Se você não tem certeza de qual opção é a certa para o seu negócio, leia as avaliações imparciais no G2.
Tipos de dados de coorte
Para dividir os usuários em grupos para realizar uma análise de coorte, dois tipos de dados de coorte precisam ser coletados: coortes de aquisição e coortes comportamentais.
Coortes de aquisição
O primeiro tipo de dados de coorte são as coortes de aquisição. Esses dados consistem em grupos divididos com base em quando eles se inscreveram ou compraram um produto. Se o seu produto for um aplicativo, você pode separar os usuários pelo dia, semana ou mês em que eles lançaram seu aplicativo pela primeira vez.
Isso significaria que você tem coortes divididas em grupos diários, semanais ou mensais. Isso permite que as empresas determinem métricas como quanto tempo as pessoas continuam a usar seu aplicativo desde o ponto de partida.
No exemplo abaixo, podemos ver uma tendência no número de usuários ativos dentro de um aplicativo móvel. Este gráfico permite a fácil visualização da curva de retenção, mostrando quando as coortes param de usar o aplicativo, além de indicar que os usuários não estão achando o aplicativo agradável ou útil após o primeiro dia de uso.
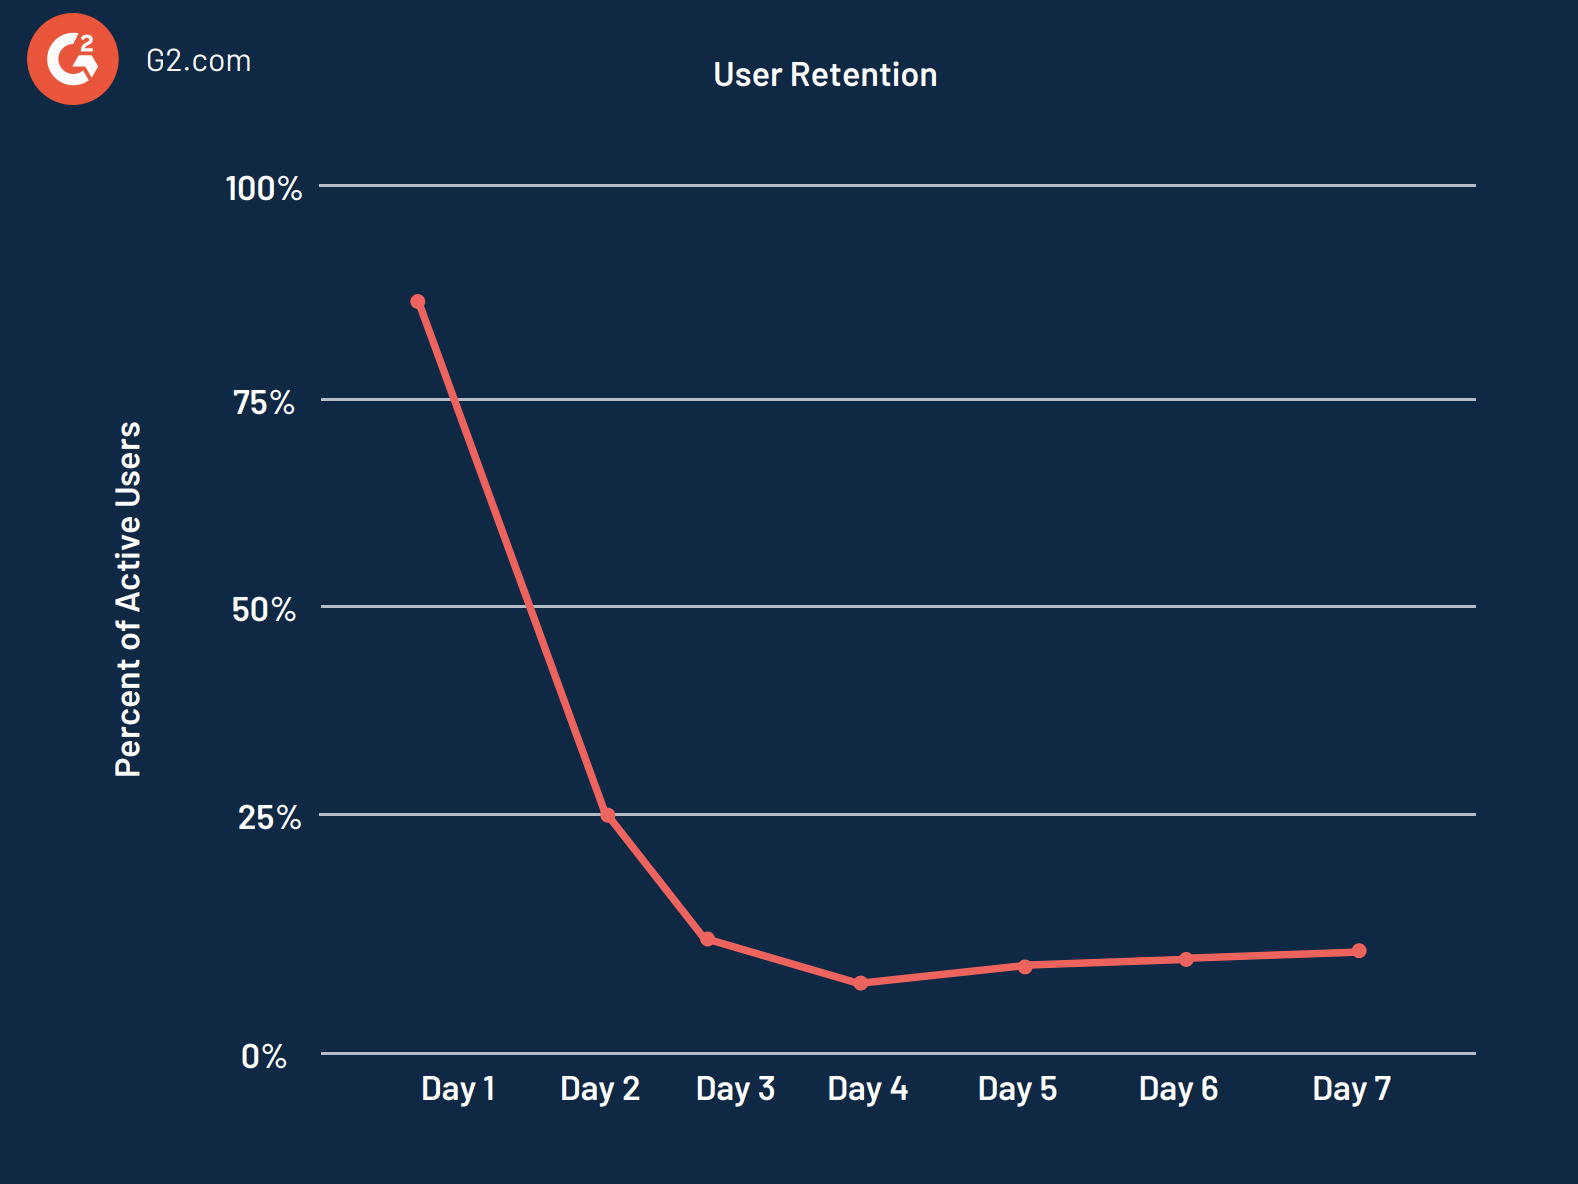
As coortes de aquisição também são ideais para quando uma tendência precisa ser identificada e quando os clientes começam a abandonar, mas pode ser difícil obter insights acionáveis a partir desses dados.
Por exemplo, você pode ver que os clientes estão saindo, mas não pode ver por que os clientes estão saindo. É aí que entram as coortes comportamentais.
Coortes comportamentais
O segundo tipo de dados de coorte são as coortes comportamentais. Esses dados consistem em grupos divididos com base em seus comportamentos e ações com seu produto.
Para usar o exemplo do aplicativo novamente, há uma variedade de ações que um usuário pode realizar, como quando ele instalou o aplicativo pela primeira vez, quando o aplicativo foi então lançado e se ocorreram transações.
Fazer isso permite que as empresas monitorem quanto tempo diferentes coortes permanecem ativas dentro do aplicativo após realizarem ações específicas. Isso é feito com o gráfico padrão de análise de coorte, que inclui células com sombreamento variado, para que você possa ver ações específicas dos usuários, como se uma transação ocorreu ou se um usuário abandonou seu carrinho.
Benefícios da análise de coorte
Agora que dividimos como realizar uma análise e como ler um gráfico de coorte, vamos explorar todos os benefícios que uma análise de coorte trará para o seu negócio.
Melhorar a retenção de clientes
Como o processo de análise de coorte envolve um mergulho profundo em grupos de pessoas e a observação de seu comportamento, é uma maneira ideal de melhorar a retenção de clientes.
Isso é feito utilizando tanto coortes de aquisição quanto comportamentais. Isso permite medir o engajamento ao longo do tempo, então é fácil ver onde os clientes estão desistindo. Por exemplo, uma diminuição na atividade dos usuários antigos pode ser mascarada por um crescimento impressionante de novos usuários, o que resulta em ocultar a falta de engajamento de um pequeno número de pessoas.
Não só você pode ver uma imagem melhor do ciclo de vida do produto com a análise de coorte, mas também do ciclo de vida do usuário. Graças às coortes de aquisição e comportamentais, você verá ações específicas ao longo de um período de tempo especificado.
Entender os efeitos de comportamentos únicos
Às vezes, a ação de segmentar seus clientes pela data em que fizeram uma compra não é útil, porque não é específica o suficiente para obter uma imagem clara de como cada um de seus clientes é diferente. Quando você agrupa suas coortes por seu comportamento com seu site ou aplicativo, isso permite que sua empresa veja uma imagem mais clara de como os clientes interagem com seu produto ao longo de seu ciclo de vida.
Com a análise de coorte, você pode definir esses grupos de usuários com base nas ações que eles realizam, ou nas que não realizam. Isso pode ser qualquer coisa, desde como eles navegam pelo seu site, quando seu uso com seu aplicativo começa a diminuir, ou quando e por que um usuário abandonaria seu carrinho antes de fazer uma compra.
Testar uma hipótese
A análise de coorte também torna simples testar rapidamente e efetivamente uma hipótese, além de receber feedback relevante e oportuno.
Digamos que uma hipótese seja que uma ação específica realizada no site da sua empresa, como receber um desconto, aumentará as chances de um cliente se inscrever para um teste gratuito. Se esse for o caso, você pode definir coortes específicas e comparar os resultados para ver como cada coorte respondeu a essa ação.
Teste A/B
É comum que as empresas usem software de teste A/B para rastrear sua base de usuários, e quando combinado com a análise de coorte, ainda mais insights aguardam.
A análise de coorte permite testes A/B enquanto você também controla variáveis que, em algum momento, afetarão vários resultados, como tempo e lugar. Isso significa que sua empresa pode criar testes melhores, aprender ainda mais com seus clientes e vê-los de um ângulo diferente ao segmentá-los de novas maneiras.
Quando sua empresa usa ambos, abrirá a porta para informações mais precisas e detalhadas. Se você não tem certeza de qual ferramenta de teste A/B é a certa para o seu negócio, dê uma olhada nas avaliações imparciais que aguardam no G2 no link acima.
Desafios da análise de coorte
Embora seja claro que há muitos benefícios na análise de coorte, bem como muitas razões pelas quais sua empresa deve usá-la, há alguns desafios que você pode enfrentar.
- Para realizar uma análise de coorte eficaz, você pode descobrir que sua empresa precisa acompanhar um grande número de coortes por um longo período de tempo.
- O processo de análise de coorte pode ser caro e demorado.
- Você pode ter participantes que deixam a coorte, o que pode distorcer os resultados e torná-los tendenciosos.
- Sua empresa deve ter um analista de dados na equipe que possa ajudar a ler os resultados da análise.
Exemplos de análise de coorte
O resultado de uma análise de coorte é incrivelmente útil, não importa o setor em que sua empresa se enquadre. Para alguns exemplos específicos do setor, continue lendo.
E-Commerce
Se sua empresa está no setor de e-commerce, você pode usar a análise de coorte para analisar o comportamento de seus clientes. Talvez você esteja interessado em ver quais de seus clientes fizeram uma compra nos últimos 90 dias e esteja procurando analisar os padrões durante uma venda ou promoção específica que você realizou durante esse tempo.
Com a análise de coorte, você verá que a experiência do cliente com seu site, produto ou serviço, não é a mesma para todos.
SaaS
Aqueles no setor de SaaS podem descobrir que a análise de coorte é a maneira perfeita de analisar os dados de seus clientes que se inscreveram para seu novo lançamento de produto ou atualização de plataforma. Também pode ser usado para ver quais de seus clientes estão usando uma ferramenta ou recurso específico dentro de um aplicativo.
As empresas de SaaS também podem usar a análise de coorte como uma forma de entender outras métricas, como ciclo de vida do cliente, abandono e valor vitalício.
Fintech
Um setor que pode se beneficiar mais da análise de coorte é o fintech, já que o engajamento a longo prazo é a principal maneira de as empresas desse setor verem sucesso.
Quando a análise de coorte é usada para examinar a retenção do comportamento do usuário, as organizações podem ver uma linha do tempo da porcentagem de usuários que retornaram para completar ações específicas, bem como os usuários que abandonaram. Isso permite que a jornada do cliente seja totalmente analisada ao longo do tempo para garantir a máxima otimização das campanhas de marketing.
Isso é especialmente útil para o setor fintech porque essas empresas podem analisar comportamentos apropriados e construir padrões de usuários à medida que agrupam clientes com base em suas ações com seu produto ou serviço.
Jogos
Um setor particular e único que é impactado pela análise de coorte é o setor de jogos, mas não é surpresa que ele dependa do comportamento do usuário para poder acelerar seu crescimento. É imprescindível para entender o caminho do usuário para compras no aplicativo, por que os jogadores estão desistindo e como segmentar jogadores específicos com o maior valor vitalício.
Com a análise de coorte, você pode agrupar todos os usuários que abandonam durante um tempo específico e identificar todas as características comuns que eles compartilhavam. Você também pode examinar as características dos jogadores com o maior valor e ver por que eles são usuários de longo prazo e como você pode garantir que mais jogadores sigam o mesmo caminho.
Marketing de conteúdo
Aqueles que trabalham em marketing de conteúdo muitas vezes dependem de métricas como compartilhamentos sociais e cliques, em vez de investigar o comportamento daqueles que interagem com seu conteúdo. É aí que entra a análise de coorte, que permite rastrear coisas como engajamento e taxas de assinatura. Isso dá aos profissionais de marketing de conteúdo uma visão mais clara das preferências de seus usuários e como seu comportamento pode afetar as conversões.
A análise de coorte também pode segmentar leitores em quem é o mais importante, ou neste caso, quem está vindo para o seu site ou blog com mais frequência. Isso pode fornecer insights sobre como aumentar a lealdade do cliente e a retenção de usuários.
Por exemplo, quando você pode restringir qual tipo de usuário compartilha seu conteúdo com mais frequência, você pode determinar como pode encorajar essas coortes a compartilhar ainda mais.
É tudo um esforço de grupo
A análise de coorte eficaz é a ferramenta que sua empresa precisa para medir o engajamento do usuário com seu produto ou serviço. Se você deseja entender melhor seus clientes ou explorar as mudanças que sua empresa experimentou, a análise de coorte é o lugar perfeito para começar.
Para começar sua própria análise de coorte, saiba mais sobre software de análise de produtos que pode permitir que você descubra os insights que está procurando em relação ao seu produto específico e como os clientes interagem com ele.

Mara Calvello
Mara Calvello is a Content and Communications Manager at G2. She received her Bachelor of Arts degree from Elmhurst College (now Elmhurst University). Mara writes content highlighting G2 newsroom events and customer marketing case studies, while also focusing on social media and communications for G2. She previously wrote content to support our G2 Tea newsletter, as well as categories on artificial intelligence, natural language understanding (NLU), AI code generation, synthetic data, and more. In her spare time, she's out exploring with her rescue dog Zeke or enjoying a good book.

