Save to My Lists

FusionCharts Reviews & Product Details

RP
Partner & Business Intelligence Lead
Information Technology and Services
Mid-Market(51-1000 emp.)
More Options
Validated Reviewer
Review source: Organic
Business partner of the seller or seller's competitor, not included in G2 scores.
What do you like best about FusionCharts?

Besides having a comprehensive set of charts they are all very flexible. This means we can tailor charts according to the most complex business requirements to display information effectively while relying on a robust chart library that can handle all ranges of data. Review collected by and hosted on G2.com.

What do you dislike about FusionCharts?

With the latest versions of FusionCharts where themes can be applied and everything is configured with json we don't have anything to dislike. Review collected by and hosted on G2.com.

What problems is FusionCharts solving and how is that benefiting you?

As a consultancy company we implement Business Intelligence solutions across different industries and being able to provide the right representation for information and make dashboards eye catching is a key factor of success. We have implemented a plugin for the Pentaho business analytics suite that enables using FusionCharts seamlessly. By integrating these two worlds, a BA platform and a chart library, we are able to deliver solutions that are much more effective. Review collected by and hosted on G2.com.

FusionCharts Overview

What is FusionCharts?

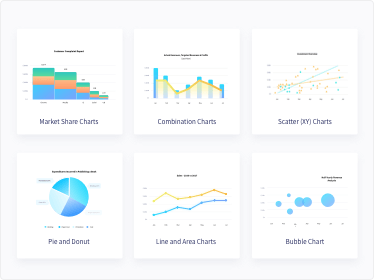
FusionCharts is a leading data visualization company that provides a wide range of interactive charts and maps to businesses and organizations worldwide. It has quickly grown in popularity because of its innovative and powerful charting solutions. FusionCharts is known for its high-quality and user-friendly products, which are used by various industries including finance, healthcare, and technology. The company's flagship product, FusionCharts Suite XT, is a JavaScript charting library that allows developers to easily create interactive and visually appealing charts for web and mobile applications. Today, FusionCharts Suite XT is used by over 800,000 developers across 28,000 companies in over 120 countries, including some well-known Fortune 500 companies. FusionCharts product suite consists of FusionCharts Suite XT - FusionCharts XT - Create interactive and responsive charts & dashboards for your web & mobile projects - FusionWidgets XT - Track your KPIs and real-time data in dashboards; - PowerCharts XT - Advanced widgets for domain-specific usage - FusionMaps XT - Offers over 2000+ geographical maps FusionTime - Visualize time series and stock data in JavaScript FusionExport - Convert your live dashboards to PDF or images FusionGrid - Rocket fuel for data-intensive applications with integrated charting Some of the key features and functionality of FusionCharts include: Interactive Charting: Create charts and dashboards for internal reporting by utilizing charting solutions such as drag-able charts, scroll charts, self-updating charts, manipulation options, and visual data selection. Time-Series Visualization: Explore visualizations from any time window by zooming in on axes to reveal specific information. Customized Data Plots: Highlight data plots, apply gradient effects, change plot colors, and more to gain relevant insights. Trendlines: Trendlines such as vertical and horizontal reference lines can be used to understand data. Data can be analyzed across several functions using trendline charts, regression lines, vertical lines, and gauges. Export Files: Maps, gauges, and charts can be exported in a variety of formats, including images, Excel spreadsheets, and PDF files. Customize the export process by displaying the exported file names in the export menu. Space Management: Save space by organizing charts in a systematic fashion. Stack and vertically align charts to organize pages. Annotations: Attract the attention of visitors using various annotations such as pictures, lines, or text on charts. It draws user attention by emphasizing comprehensive information for visitors. Integration: Client-side charts can be updated through its open-source, front- and back-end integrations.

FusionCharts Details
Languages Supported
English
Show LessShow More
Product Description

Delightful JavaScript charts for all your web & enterprise apps

How do you position yourself against your competitors?

Ease of Use: There is no need for an initial learning curve. With accessible instructions, you can create visualization charts in 15 minutes.

Powerful Visualization: Transform vast amounts of data into insightful reports and present them in an interactive dashboard using its library of robust components.

Free Trial: You can start the free version for 14 days before purchasing the full version.

Transparent Licensing Policies: We do not charge for per-production or per-testing servers. Once you've bought the license, you can use accessible hosting across several servers.

Flexible Pricing: Offers flexible pricing plans per usage, such as internal vs. SaaS, team size, and perpetual vs. annual subscription.


Seller Details
Year Founded
1999
HQ Location
Houston, TX
Twitter
@MigrationWiz
498 Twitter followers
LinkedIn® Page
www.linkedin.com
66 employees on LinkedIn®
Description

Idera, Inc. provides a suite of software tools that help businesses manage and optimize their IT environments. Its offerings include database management, application development, and IT performance monitoring solutions, catering to organizations of all sizes.


F
Overview Provided by:

Recent FusionCharts Reviews

Verified User
A
Verified UserSmall-Business (50 or fewer emp.)
1.5 out of 5
"Used to be a good product 10 years ago."
Lots of different charts Fairly consistent parameters between charts Fairly easy to implement.
Verified User
U
Verified UserMid-Market (51-1000 emp.)
4.0 out of 5
"Very helpful for understanding data analytics."
Some of its key features include a large selection of chart types, support for real-time data visualization, interactive animations and drill-downs...
IB
Ian B.Small-Business (50 or fewer emp.)
5.0 out of 5
"Simple to implement, powerful and beautiful to look at"
I like the variety of charts and graphs available, as well as the simplicity to both implement with complex data as well as the ability to theme th...

FusionCharts Media

Answer a few questions to help the FusionCharts community
Have you used FusionCharts before?
Yes

34 out of 35 Total Reviews for FusionCharts

4.4 out of 5
The next elements are filters and will change the displayed results once they are selected.
Search reviews
Popular Mentions
The next elements are radio elements and sort the displayed results by the item selected and will update the results displayed.
Hide FiltersMore Filters
The next elements are filters and will change the displayed results once they are selected.
34 out of 35 Total Reviews for FusionCharts
4.4 out of 5
34 out of 35 Total Reviews for FusionCharts
4.4 out of 5

FusionCharts Pros and Cons

How are these determined?Information
Pros and Cons are compiled from review feedback and grouped into themes to provide an easy-to-understand summary of user reviews.
Pros
Cons

Overall Review Sentiment for FusionChartsQuestion

Time to Implement
<1 day
>12 months
Return on Investment
<6 months
48+ months
Ease of Setup
0 (Difficult)
10 (Easy)
Log In
Want to see more insights from verified reviewers?
Log in to view review sentiment.
G2 reviews are authentic and verified.
Verified User in Oil & Energy
AO
Small-Business(50 or fewer emp.)
More Options
Validated Reviewer
Verified Current User
Review source: Organic
What do you like best about FusionCharts?

Lots of different charts

Fairly consistent parameters between charts

Fairly easy to implement. Review collected by and hosted on G2.com.

What do you dislike about FusionCharts?

After company/product was sold a couple of years ago no, it seems to us no there is product support any more.

We have many open support tickets and each new version introduces worse bugs.

Turnaround time to fix bugs (for us) has been over 6 months.

We have 6 open tickets going back 3 years for easily reproduceable bad bugs and each ticket is showing "under investigation".

Product is now falling behind their competitors.

We have been using the product for about 15 years, but I could no longer recommend this product for anyone starting to look for a charting package. Review collected by and hosted on G2.com.

What problems is FusionCharts solving and how is that benefiting you?

Displays visual graphs well. Review collected by and hosted on G2.com.

SN
Small-Business(50 or fewer emp.)
More Options
Validated Reviewer
Verified Current User
Review source: G2 invite on behalf of seller
Incentivized Review
What do you like best about FusionCharts?

I like the ability to have many options across different types of charts and graphs. There is always an option for the type of information my team needs to display. Review collected by and hosted on G2.com.

What do you dislike about FusionCharts?

I wish there were even more modern themes so that we did not have to add so much custom styling. FusionCharts would benefit from a UI/UX designer to assist in creation of their chart themes. Little things like rounded corners go a long way. Review collected by and hosted on G2.com.

What problems is FusionCharts solving and how is that benefiting you?

FusionCharts visually shows our data and information to our clients within our app and downloaded in pdfs. The problem we've had is conveying information in a manner that was easy to access and read. This solution has resolved that for us. Review collected by and hosted on G2.com.

SH
DevOps Engineer
Small-Business(50 or fewer emp.)
More Options
Validated Reviewer
Review source: Organic
What do you like best about FusionCharts?

FusionCharts is a JavaScript-based data visualization library that allows developers to create interactive and animated charts, graphs, and maps for web and mobile applications. It supports over 100 chart types, including bar charts, line charts, pie charts, gauges, and more.

One of the key features of FusionCharts is its ability to handle large datasets and render them quickly, making it ideal for displaying real-time data. It also provides a wide range of customization options, allowing developers to create unique and visually appealing data visualizations that match their brand or application's design.

Another advantage of FusionCharts is its ease of use. It comes with a comprehensive documentation and a wide range of examples and demos that make it easy for developers to get started with the library and create their first chart quickly.

Overall, FusionCharts is a powerful data visualization library that provides developers with a flexible and easy-to-use solution for creating compelling data visualizations. Review collected by and hosted on G2.com.

What do you dislike about FusionCharts?

One potential downside of FusionCharts is that it is a commercial library, which means that developers need to purchase a license to use it in their projects. While it does offer a free trial period, some developers may be hesitant to invest in a commercial library, especially if they only need to create a few simple charts.

Another possible limitation of FusionCharts is that it requires JavaScript to function, which may not be suitable for all development environments or platforms. Additionally, some developers may find the library's extensive customization options overwhelming, especially if they are not experienced with web development or data visualization.

Overall, while FusionCharts is a powerful and popular data visualization library, it may not be the best fit for all developers or projects. It's important to consider the specific needs and requirements of your project before deciding whether to use FusionCharts or another data visualization solution. Review collected by and hosted on G2.com.

What problems is FusionCharts solving and how is that benefiting you?

It helps us display our sensor data to our clients. We can quickly render different charts and have unique ways to visualise the data. The amount of charts available means that it is our go-to tool for rendering charts on mobile and web devices. Review collected by and hosted on G2.com.

IB
Small-Business(50 or fewer emp.)
More Options
Validated Reviewer
Verified Current User
Review source: G2 invite on behalf of seller
Incentivized Review
What do you like best about FusionCharts?

I like the variety of charts and graphs available, as well as the simplicity to both implement with complex data as well as the ability to theme the graphs to match your own theme and styles. Review collected by and hosted on G2.com.

What do you dislike about FusionCharts?

The only dislike is the support which can sometimes not read the exact question and require a revert or two. Review collected by and hosted on G2.com.

What problems is FusionCharts solving and how is that benefiting you?

We require data visualisation for our customers to view snapshots of their data in formats that make sense to them. They love the output and the variety of formats to offer them slices of their data is great. Review collected by and hosted on G2.com.

DC
Software Engineer
Small-Business(50 or fewer emp.)
More Options
Validated Reviewer
Verified Current User
Review source: Seller invite
Incentivized Review
(Original )Information
What do you like best about FusionCharts?

Fusion Charts provide our product with various charts so vast and flexible that it gives us a million possibilities to impress our users. Review collected by and hosted on G2.com.

What do you dislike about FusionCharts?

Sometimes we face some minor bugs that take quite a while to be fixed. Review collected by and hosted on G2.com.

What problems is FusionCharts solving and how is that benefiting you?

Creating panels for different modules of our products which have to be distinct but with the same look and feel, and awe our customers. Review collected by and hosted on G2.com.

Response from Joyce Guo of FusionCharts

Hi Daniel, thanks for your review and we are glad that you are getting value from FusionCharts. Please reach out to us any time when you found any bugs or facing any issues, we value your feedback and we will work hard to improve our product.

DW
A/P ANALYST
Enterprise(> 1000 emp.)
More Options
Validated Reviewer
Review source: Seller invite
Incentivized Review
(Original )Information
What do you like best about FusionCharts?

What is most helpful about Fusion Charts is the ability to export charts into various formats such as JPG, PNG, SVG and PDF saved files. I have to save several files each day for my team members to view in our shared drive. Review collected by and hosted on G2.com.

What do you dislike about FusionCharts?

At this point, I do not have any dislikes using FusionCharts. My team also hasn't had any issues using the FusionCharts for several team members meetings. This software is very user-friendly. Review collected by and hosted on G2.com.

What problems is FusionCharts solving and how is that benefiting you?

The ability to export charts into various formats such as JPG, PNG, SVG and PDF saved files. The team also uses personalized pinboard options. And we had the opportunity to use the WinForms Review collected by and hosted on G2.com.

Response from Joyce Guo of FusionCharts

Hi Deanna, thanks for your review and we are glad that you are getting value from FusionCharts. We work hard to make sure you have the top-notch visualization tool in the market. Feel free to reach out to us anytime for any feedback.

RD
CTO
Small-Business(50 or fewer emp.)
More Options
Validated Reviewer
Verified Current User
Review source: Seller invite
Incentivized Review
(Original )Information
What do you like best about FusionCharts?

Very configurable, fast, themeable, and lots of pre-built widgets. Review collected by and hosted on G2.com.

What do you dislike about FusionCharts?

We did not have any real cons about FusionCharts; we did try out other frameworks (e.g. ECharts) but FusionCharts turned out to be a lot better. Review collected by and hosted on G2.com.

What problems is FusionCharts solving and how is that benefiting you?

If you need a comprehensive framework for Angular that you can use to display a variety of charts of all kinds, FusionCharts is the best solution on the market. Review collected by and hosted on G2.com.

Response from Joyce Guo of FusionCharts

Hi Dalph, thank you for the review and we are glad that you found FusionCharts a lot better than the others! Feel free to reach out to us anytime if you have any feedback using our products.:)

Verified User in Information Technology and Services
UI
Mid-Market(51-1000 emp.)
More Options
Validated Reviewer
Review source: G2 invite on behalf of seller
Incentivized Review
(Original )Information
What do you like best about FusionCharts?

Some of its key features include a large selection of chart types, support for real-time data visualization, interactive animations and drill-downs, and easy integration with popular web frameworks such as React and Angular. Review collected by and hosted on G2.com.

What do you dislike about FusionCharts?

High cost for commercial licenses, and there is a steep learning curve for beginners who are not familiar with the library. Review collected by and hosted on G2.com.

What problems is FusionCharts solving and how is that benefiting you?

FusionCharts has a variety of chart types that we can use that contain real-time data visualization, and we can present the data using interactive animations and drill-downs. Review collected by and hosted on G2.com.

BN
Tech lead
Small-Business(50 or fewer emp.)
More Options
Validated Reviewer
Review source: Organic
What do you like best about FusionCharts?

The sheer configurability and myriad chart types makes this tool an absolute must for our business. It seems the team at FusionCharts hasn't left anything out of their offering. Review collected by and hosted on G2.com.

What do you dislike about FusionCharts?

The examples could be a bit more comprehensive especially where the chart configuration gets complicated. That said, their support is steller so that's the fallback. Review collected by and hosted on G2.com.

What problems is FusionCharts solving and how is that benefiting you?

We're using FusionCharts to create various charts that we're embedding into a report. The charts bring to life the report and ultimately make the report more readable and understandable. Review collected by and hosted on G2.com.

Response from Joyce Guo of FusionCharts

Hi Bob, thanks for your review and we are glad that you are getting value from FusionCharts. Your feedback is very much valued and we will do our best to improve in all aspects. Please feel free to reach out to us if you find any roadblocks using FusionCharts anytime.

Verified User in Hospital & Health Care
AH
Mid-Market(51-1000 emp.)
More Options
Validated Reviewer
Verified Current User
Review source: Organic
(Original )Information
What do you like best about FusionCharts?

It's very easy to install and use. It has alot of assortments. Review collected by and hosted on G2.com.
What do you dislike about FusionCharts?

There's absolutely nothing I can think of. It's such a great product. Review collected by and hosted on G2.com.
What problems is FusionCharts solving and how is that benefiting you?

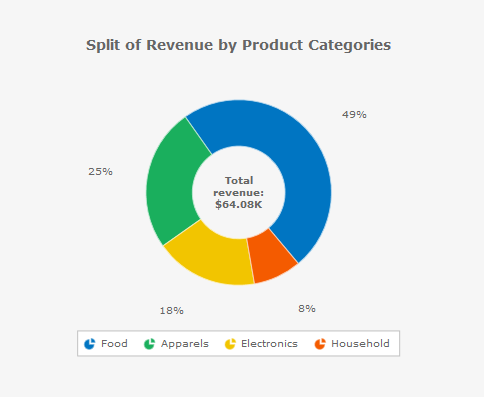
The great benefit is that it offers awesome visualizations Review collected by and hosted on G2.com.