Top Rated Flexmonster Pivot Table & Charts Component Alternatives

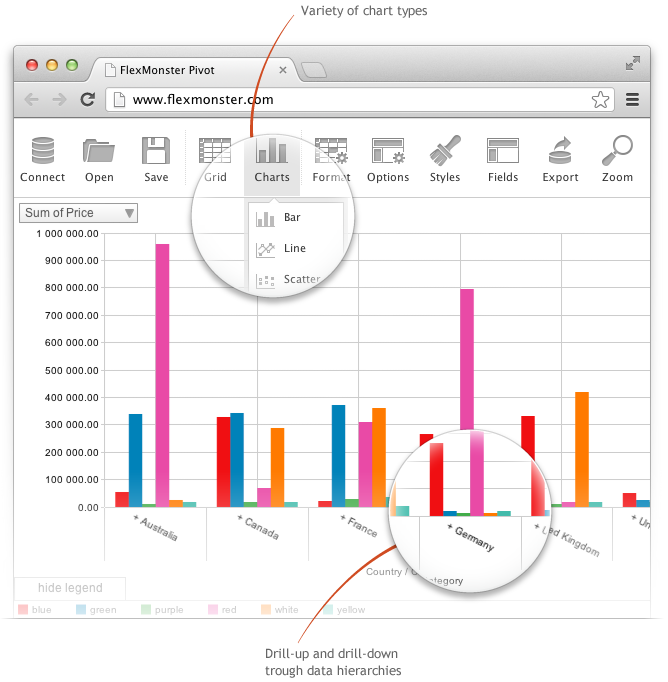
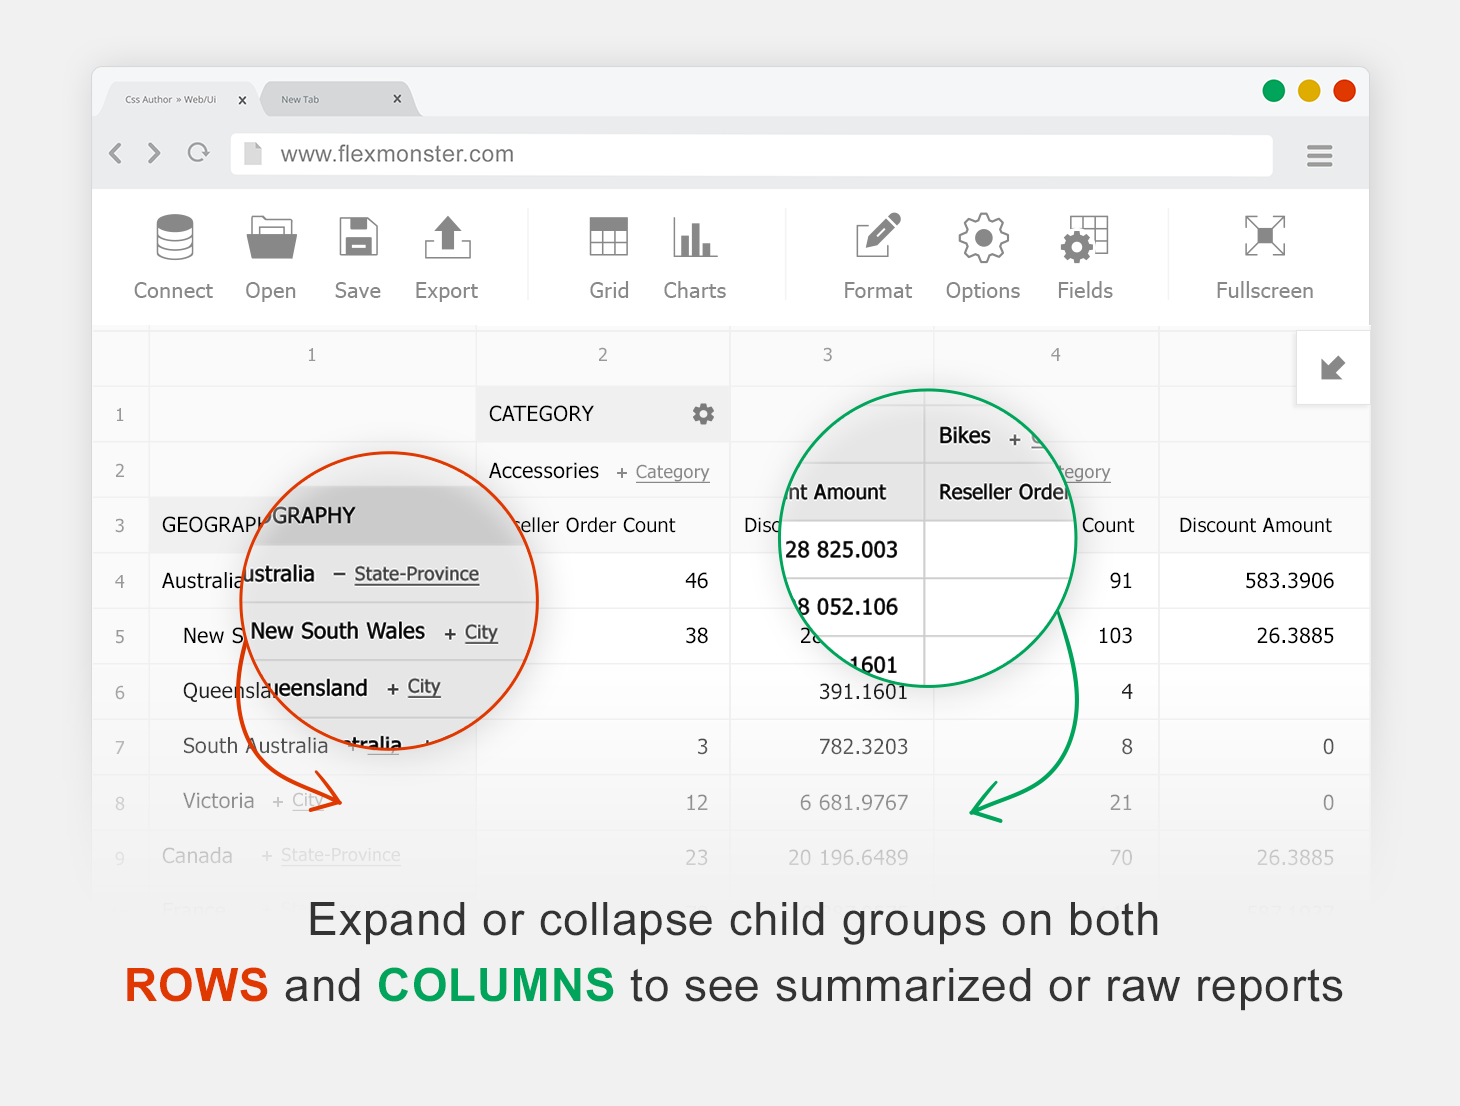
Flexmonster provides pivot tables and chart UI elements that easily integrate into customer-facing dashboards. Common pivot table features are supported including multiple dimensions, hierarchy support, and row filtering options. The conditional formatting feature is easy to use, and you have the ability to save cube definitions with or without data Exporting directly to Excel and PDF formats works seamlessly. Flexmonster has several built in UI themes, or you can create your own. Review collected by and hosted on G2.com.
As others have said, pricing is a bit steep, especially for small businesses. For SaaS integrations, tiers are based off of the number of active clients, which disincentivises numerous small value engagements. That being said, building our own solution would certainly be a larger investment than this licence. Review collected by and hosted on G2.com.
10 out of 11 Total Reviews for Flexmonster Pivot Table & Charts Component

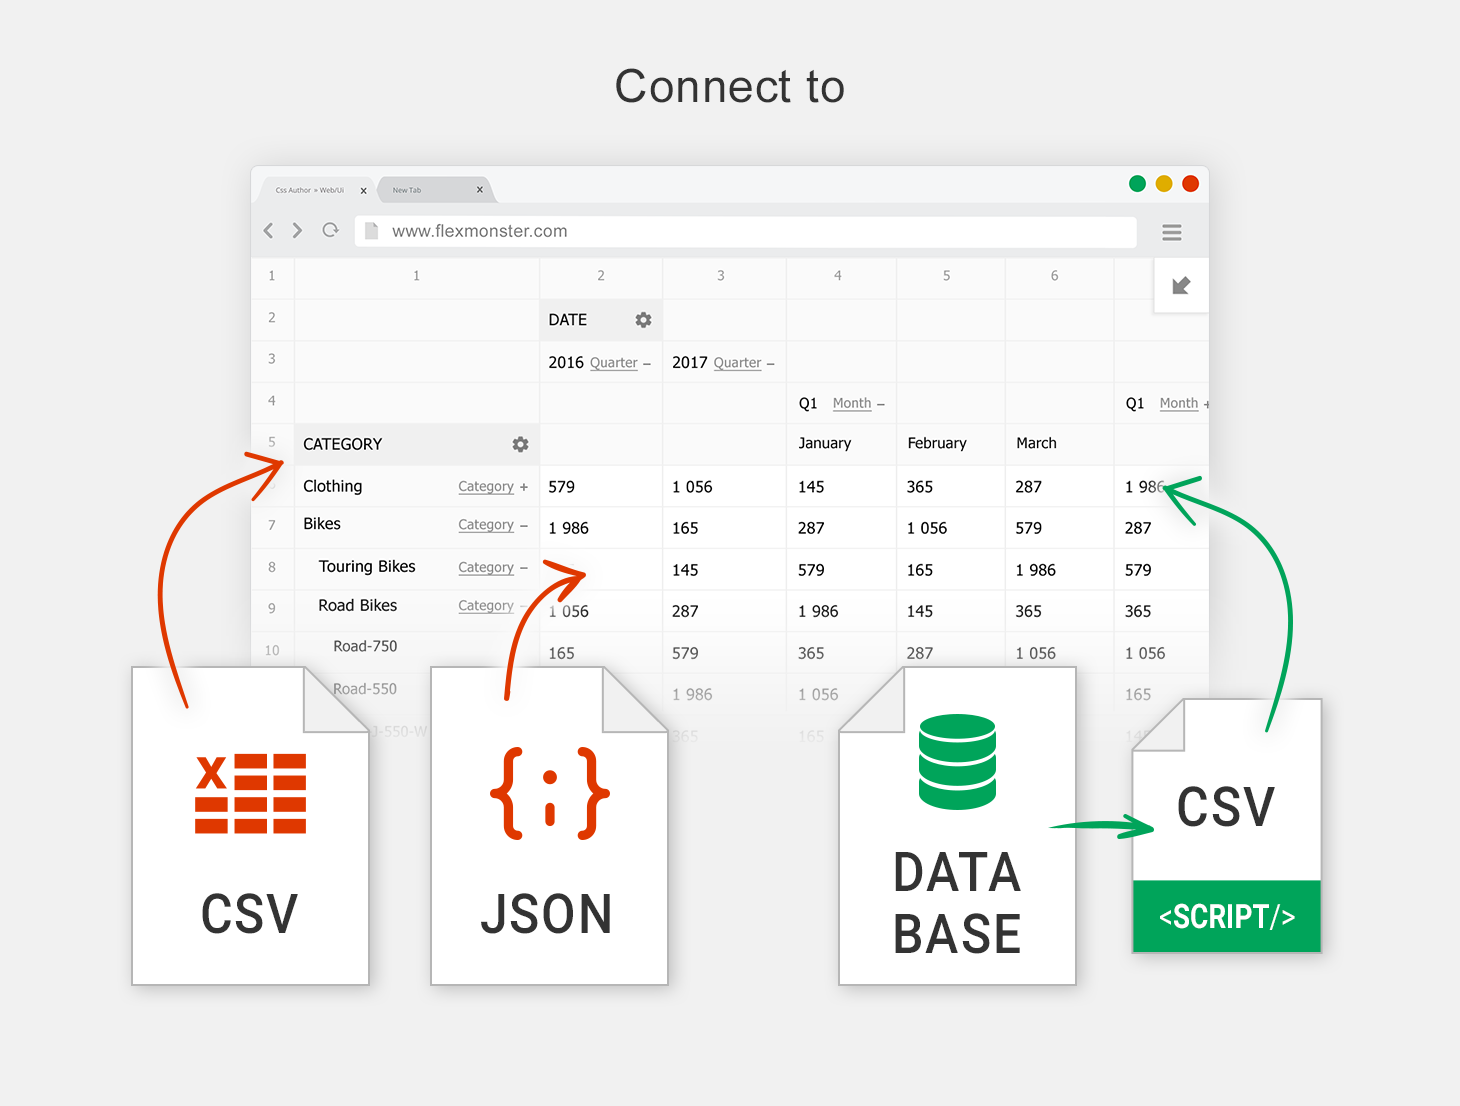
One aspect that stood out for flex monster is the robustness and its ease of use. It was also tested to provide pivots and charts from large data sets and it did not disappoint. The surprising part was that we could get output within few clicks. Moreover, it extracted meaningful and analytical data points from a range of data sources like json, jquery and SQL files. Flexmonster being web app agnostic, also easily integrated with all web applications Review collected by and hosted on G2.com.
I think many of the users have already pointed out that cost is pretty much on the higher side. Other than this, the system ran into error once while trying to extract data from csv data source. Otherwise the experience was decent Review collected by and hosted on G2.com.
Using this the Problem of less understanding with the carts got solved, With this feature it's very easy to get familiar with the most difficult part of streamlining the data. Review collected by and hosted on G2.com.
It's not that much capable to hold the small databases for very large data it's perfect Review collected by and hosted on G2.com.
Flexmonster charts and pivot tables are very useful tool business intelligence and data visualization for management for their decision making. It is very easy to use and available charts are providing useful information by data analysis. Review collected by and hosted on G2.com.
Since i am using this software i did not found any dislike yet but more charts needs to included. Review collected by and hosted on G2.com.
A powerful tool that easy-to use, simple and fast, allowing users to analyze datasets and create useful graphs Review collected by and hosted on G2.com.
Nothing, except the price. Although the tool is very useful, it is quite expensive. Review collected by and hosted on G2.com.

The drag and drop, data connectors, and data visualization tools are the best. We are able to generate reports for business analysis and management in real time. Review collected by and hosted on G2.com.
Nothing much. Their software and support have been excellent. Review collected by and hosted on G2.com.

FlexMonster is one the best tool to get accurate and proper pivot tables and pivot charts. The best part of this tool is its speed of performing its job. Even if you are working in very large volumes, it will provide you with accurate and awesome tables and charts in no time. FlexMonster can extract data itself from the common data sources like MS Analysis Services, JSON, SQL tools and databases. Another amazing part of this tool is its integration your system. It supports almost all programming languages but the best fit in is JavaScript. It is highly customizable with JavaScript API, which makes it more convenient for the users to understand they can easily customize the things they want to appear on their dashboards and can use them properly without any hectic routine of finding the tool icons with the software. The user interface of FlexMonster is more like of MS excel which makes it more easier for the users as almost all of them are always familiar to the excel. Flex Monster’s ability to create 1-click report is so amazing. It can easily be integrated into to the webpages or web apps. It works amazingly on both desktop browser applications and mobile applications whether they are iOS or android. Review collected by and hosted on G2.com.
One of the major drawback of this tool is its worth. It is quite expensive for the new organizations, which are new to such tools and want to automate their work. That is why most of professional users avoid this tool because of its price tag. Review collected by and hosted on G2.com.

FLEXible, am able to create specific 1-click reports straight from a database onto a web page, and users can customize it even further if they like. Since it is so simple, I can create front ens to allow users to pick/ customize the data source.... This makes it even more flexible since I do not need a separate page for every single data source.
Getting a simple proof of concept to show users took only minutes Review collected by and hosted on G2.com.
Hoping for more users to make comments and give ideas about things they have discovered to do with it Review collected by and hosted on G2.com.

It can easily be integrated into any webpage or webapp. It supports pivot reports and custom charts and supports data sources like SQL, JSON and CSV files. It's very flexible and easy to use. Also, it works seamlessly with most browser on all platforms, iOS, Android, Windows, Mac and Linux. Review collected by and hosted on G2.com.
I think it's quite expensive, but other than that it's worth the money. Review collected by and hosted on G2.com.
When it comes to analysing datasets, before one even drills down into details, it is about ease of use and speed. And this is where Flexmonster excels (no pun intended, as one can obviously use Excel to create pivot tables, but this is simply no comparison when it comes to quickly dropping in large datasets) Review collected by and hosted on G2.com.
Wouldn't you wish it was free?
But seriously, during my testing of CSV datasets of any size I didn't run into any problems and was able to produce the desired outputs faster than with any other tool I have used (like Webix Pivot or PivotJS) Review collected by and hosted on G2.com.
Flexibility to process pivot tables and multi-platform features. It also works great on smartphones. Review collected by and hosted on G2.com.
1) 100MB limit isn't good enough, considering that Excel supports files with <=1M rows.
2) Quality of graphs is not so good as ggplot2 in R Review collected by and hosted on G2.com.


