Show rating breakdown
Save to My Lists
Claimed
Claimed

Top Rated Flexmonster Pivot Table & Charts Component Alternatives

Flexmonster Pivot Table & Charts Component Reviews & Product Details

Danut Mihai F.
DF
Chief Executive Officer
Small-Business(50 or fewer emp.)
More Options
Validated Reviewer
Review source: G2 invite
Incentivized Review
What do you like best about Flexmonster Pivot Table & Charts Component?

It can easily be integrated into any webpage or webapp. It supports pivot reports and custom charts and supports data sources like SQL, JSON and CSV files. It's very flexible and easy to use. Also, it works seamlessly with most browser on all platforms, iOS, Android, Windows, Mac and Linux. Review collected by and hosted on G2.com.

What do you dislike about Flexmonster Pivot Table & Charts Component?

I think it's quite expensive, but other than that it's worth the money. Review collected by and hosted on G2.com.

Recommendations to others considering Flexmonster Pivot Table & Charts Component:

You should try the 30-days trial, to make sure it's the right tool for you. Review collected by and hosted on G2.com.

What problems is Flexmonster Pivot Table & Charts Component solving and how is that benefiting you?

The project I worked on, required processing of large amounts of data and a way to display that data and sort it quickly. Flexmonster Pivot Table & Charts offers an intuitive spreadsheet design display (similar with Excel) and gave us the opportunity to compare data, find patterns and create reports in an efficient way. Besides this, Flexmonster Pivot Table & Charts comes with an extensive API with which we could customize our product further. Review collected by and hosted on G2.com.

Flexmonster Pivot Table & Charts Component Overview

What is Flexmonster Pivot Table & Charts Component?

The Flexmonster Pivot Table & Charts Component allows users to create pivot tables and pivot charts. - Easy to integrate: can be natively used with JavaScript or TypeScript and perfectly integrates with client-side frameworks such as AngularJS, Angular, React, Vue.js, and Blazor as good as with the server side like ASP.NET, Java JSP, and others. - Supports the most common data sources: Microsoft Analysis Services, OLAP cubes, Mondrian, icCube, JSON, SQL (MS SQL, MySQL, and others) databases, and static CSV files. - Allows you to work extremely fast with really large data volumes (huge OLAP cubes, data sets from SQL DBs, or files up to 1 GB). - No limit on the server-side technology, whether your website runs on .NET, Java, PHP, Ruby, etc. - Fully customizable with extensive JavaScript API. Pivot Component provides Excel-like features which give users the interface they have always been used to. The users can easily and quickly analyze data and produce reports using different options.

Flexmonster Pivot Table & Charts Component Details
Show LessShow More
Product Description

Professional set of HTML5, JavaScript, Flash and Flex components for displaying pivot charts and easily creating chart-based reports out of them


Seller Details
Year Founded
2008
HQ Location
Rancho Santa Fe, CA
Twitter
@flexmonster
1,133 Twitter followers
LinkedIn® Page
www.linkedin.com
22 employees on LinkedIn®

Olesia S.
OS
Overview Provided by:
Marketing Analyst

Recent Flexmonster Pivot Table & Charts Component Reviews

Henry S.
HS
Henry S.Small-Business (50 or fewer emp.)
4.5 out of 5
"Easy and flexable pivot tables & charts"
Flexmonster provides pivot tables and chart UI elements that easily integrate into customer-facing dashboards. Common pivot table features are supp...
Verified User
U
Verified UserMid-Market (51-1000 emp.)
5.0 out of 5
"Charts And Tables pivoted in a very user friendly Manner"
Using this the Problem of less understanding with the carts got solved, With this feature it's very easy to get familiar with the most difficult pa...
Kiran Ramakrishna i.
KI
Kiran Ramakrishna i.Enterprise (> 1000 emp.)
4.0 out of 5
"Flexmonster- A growing and improving pivot table provider"
One aspect that stood out for flex monster is the robustness and its ease of use. It was also tested to provide pivots and charts from large data s...
Security Badge
This seller hasn't added their security information yet. Let them know that you'd like them to add it.
0 people requested security information

Flexmonster Pivot Table & Charts Component Media

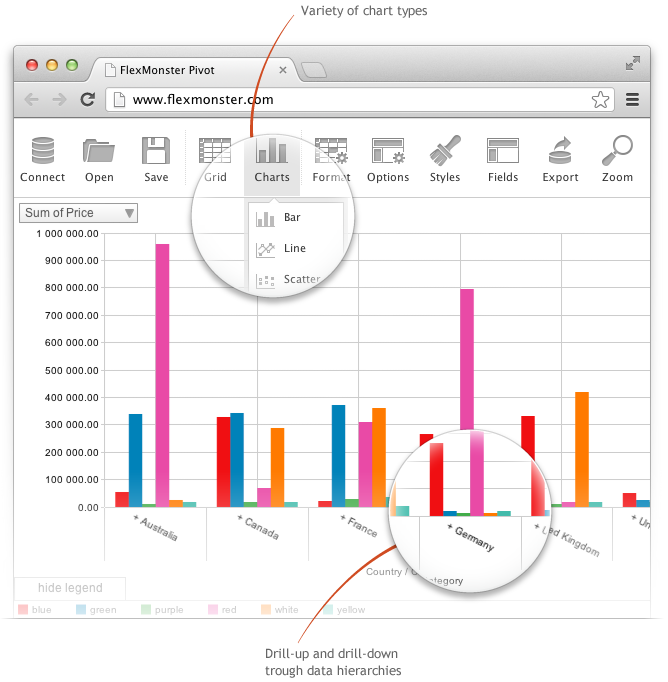
Flexmonster Pivot Table & Charts Component Demo - Pivot Charts. Interactive drillable pivot charts
Pivot Charts provide an alternative, interactive way to visualize data.
Flexmonster Pivot Table & Charts Component Demo - Export and Print.  Export to PDF, Excel, HTML, CSV and images
Pivot Component supports the printing of the Pivot view. Additionally the users can export the reports into a variety of formats.
Flexmonster Pivot Table & Charts Component Demo - Create an informative dashboard view using pivot grid and charts.
The dashboard can contain several instances of Flexmonster Pivot (using different report configurations) and various charts. That allows you to create the custom interactive live report with the needed visualization type.
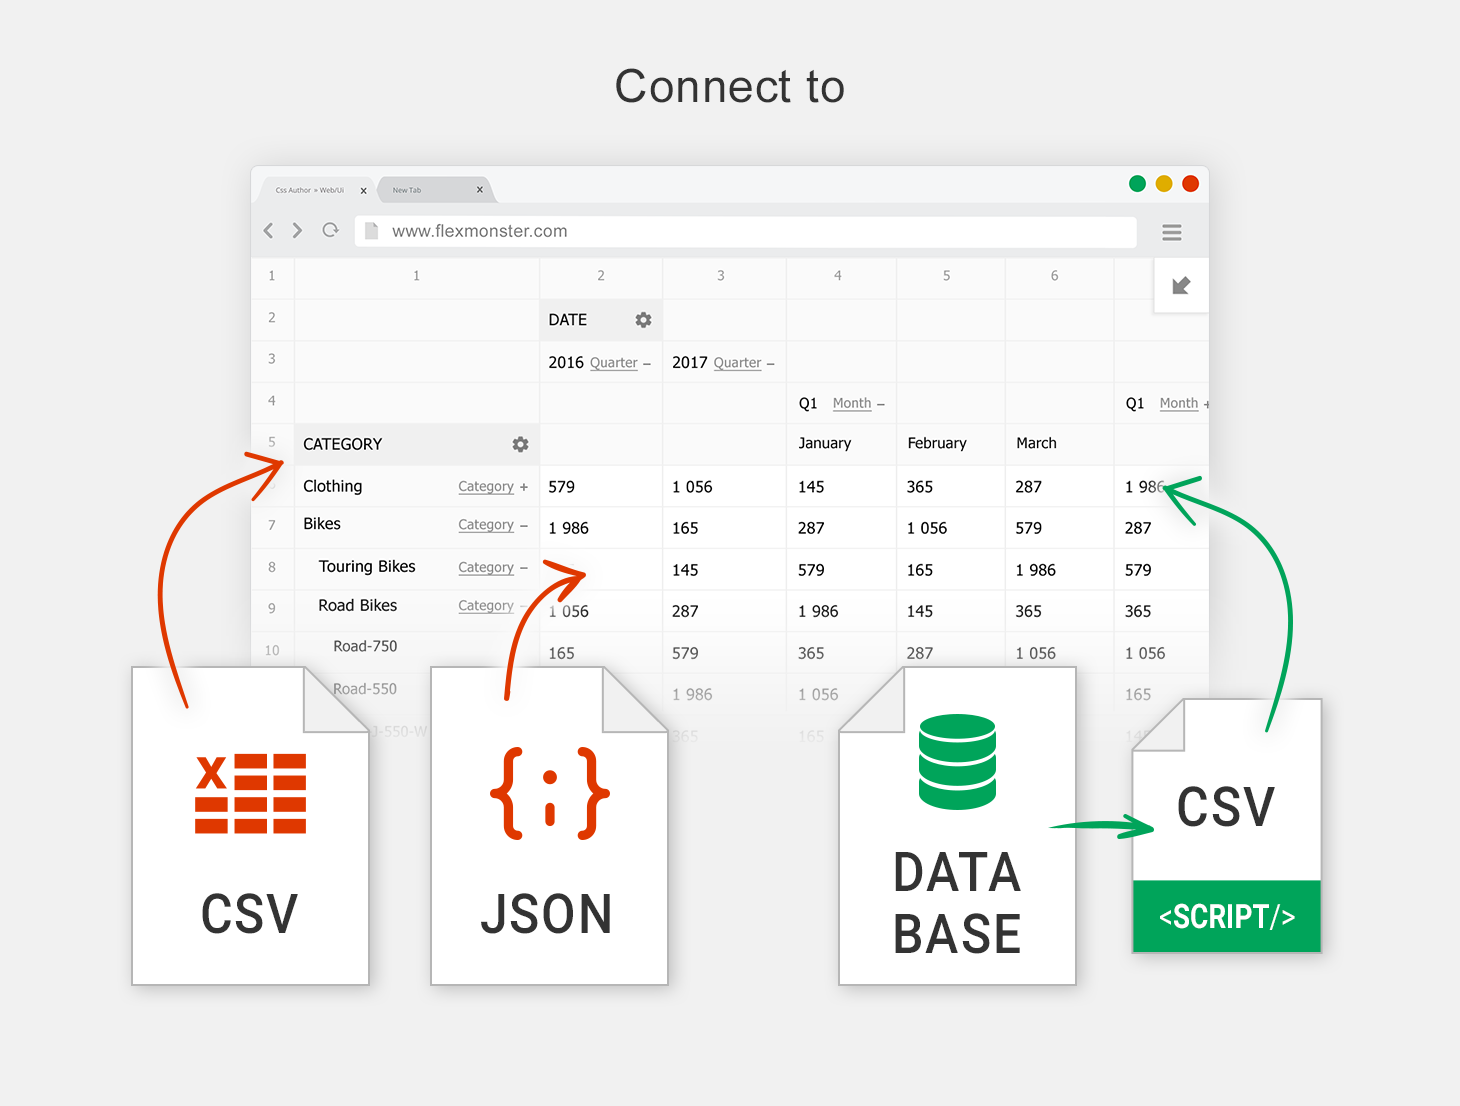
Flexmonster Pivot Table & Charts Component Demo - SSQL/CSV database. Gets data from SQL database or CSV / JSON sheets
The component will connect to any database: MS SQL, MySQL, Oracle, PostgreSQL - using simple script generating CSV / JSON output to enable real-time business analysis. Pivot Component is full browser-side component, thus you can use any desired server-side to generate CSV / JSON data: ASP, PHP, A...
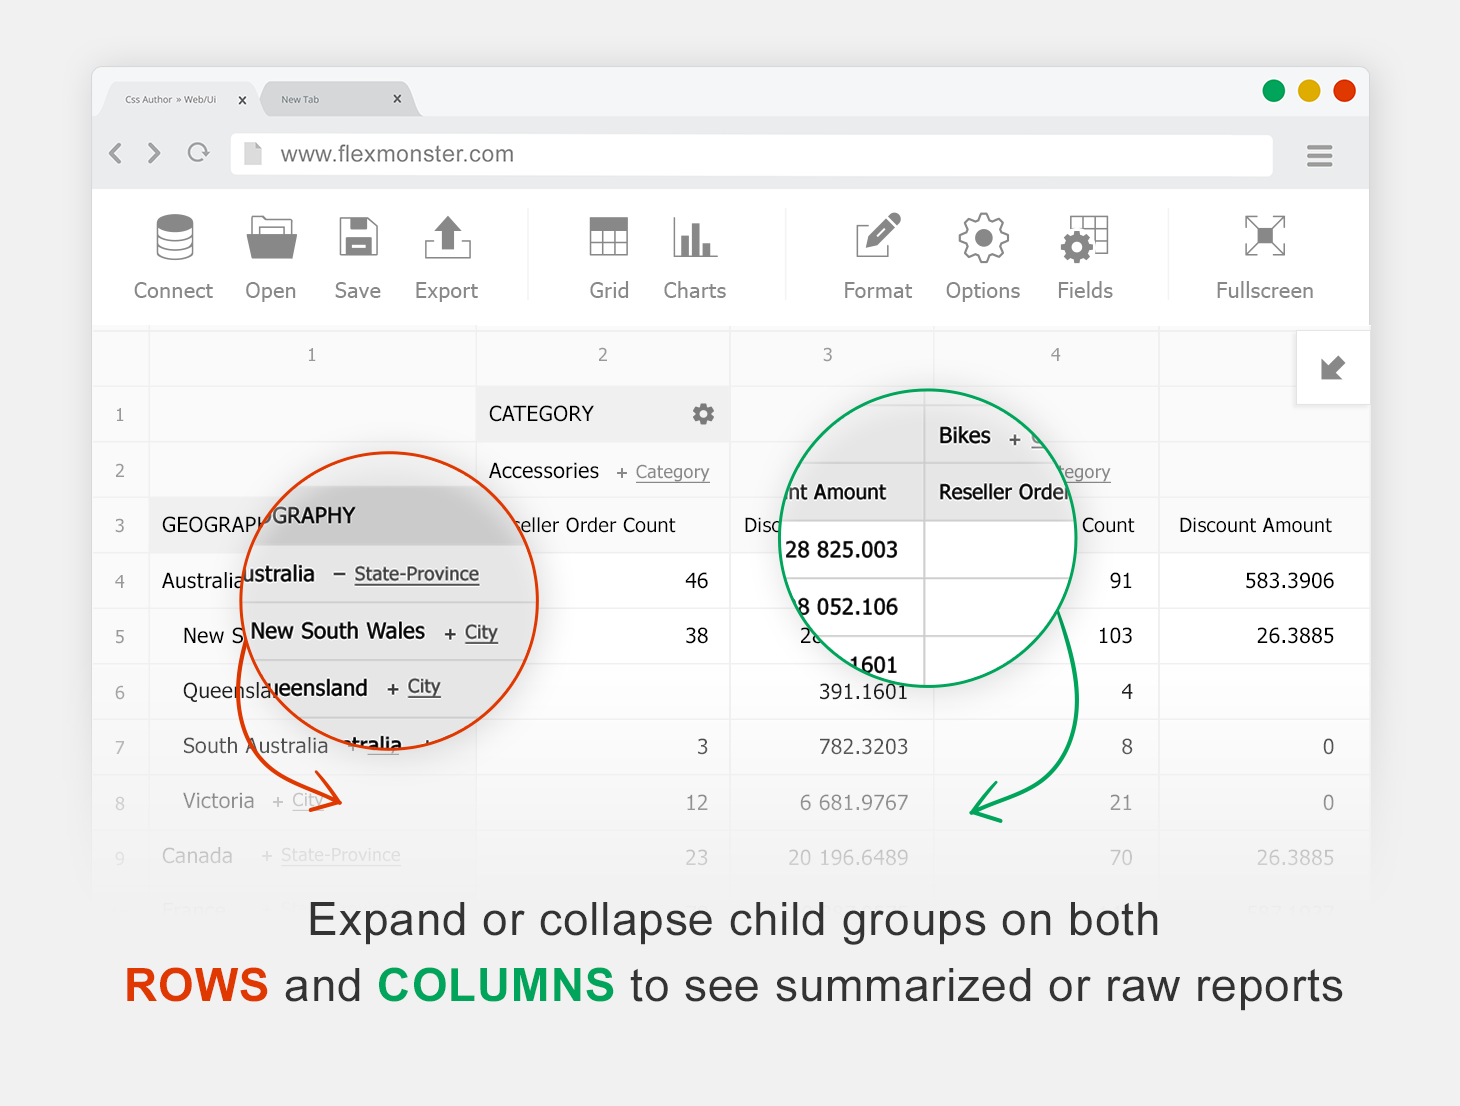
Flexmonster Pivot Table & Charts Component Demo - Pivot Table. Hierarchical data display & grouping
Expand or collapse child groups on both rows and columns to see summarized or raw reports
Answer a few questions to help the Flexmonster Pivot Table & Charts Component community
Have you used Flexmonster Pivot Table & Charts Component before?
Yes

10 out of 11 Total Reviews for Flexmonster Pivot Table & Charts Component

4.3 out of 5
The next elements are filters and will change the displayed results once they are selected.
Search reviews
Popular Mentions
The next elements are radio elements and sort the displayed results by the item selected and will update the results displayed.
Hide FiltersMore Filters
The next elements are filters and will change the displayed results once they are selected.

Flexmonster Pivot Table & Charts Component Pros and Cons

How are these determined?Information
Pros and Cons are compiled from review feedback and grouped into themes to provide an easy-to-understand summary of user reviews.
Pros
Cons
G2 reviews are authentic and verified.
Henry S.
HS
VP, Infrastructure
Small-Business(50 or fewer emp.)
More Options
Validated Reviewer
Verified Current User
Review source: Organic
What do you like best about Flexmonster Pivot Table & Charts Component?

Flexmonster provides pivot tables and chart UI elements that easily integrate into customer-facing dashboards. Common pivot table features are supported including multiple dimensions, hierarchy support, and row filtering options. The conditional formatting feature is easy to use, and you have the ability to save cube definitions with or without data Exporting directly to Excel and PDF formats works seamlessly. Flexmonster has several built in UI themes, or you can create your own. Review collected by and hosted on G2.com.

What do you dislike about Flexmonster Pivot Table & Charts Component?

As others have said, pricing is a bit steep, especially for small businesses. For SaaS integrations, tiers are based off of the number of active clients, which disincentivises numerous small value engagements. That being said, building our own solution would certainly be a larger investment than this licence. Review collected by and hosted on G2.com.

What problems is Flexmonster Pivot Table & Charts Component solving and how is that benefiting you?

Flexmonster provides customizable, embedded financial dashboards and reporting for our customers. Review collected by and hosted on G2.com.

Kiran Ramakrishna i.
KI
Enterprise(> 1000 emp.)
More Options
Validated Reviewer
Review source: G2 invite
Incentivized Review
What do you like best about Flexmonster Pivot Table & Charts Component?

One aspect that stood out for flex monster is the robustness and its ease of use. It was also tested to provide pivots and charts from large data sets and it did not disappoint. The surprising part was that we could get output within few clicks. Moreover, it extracted meaningful and analytical data points from a range of data sources like json, jquery and SQL files. Flexmonster being web app agnostic, also easily integrated with all web applications Review collected by and hosted on G2.com.

What do you dislike about Flexmonster Pivot Table & Charts Component?

I think many of the users have already pointed out that cost is pretty much on the higher side. Other than this, the system ran into error once while trying to extract data from csv data source. Otherwise the experience was decent Review collected by and hosted on G2.com.

What problems is Flexmonster Pivot Table & Charts Component solving and how is that benefiting you?

At our company, used the Flexmonster to process huge chunk of data and derive meaningful insights out of it. Flexmonster provided very enlightening information with charts, tables and reports. It also can be integrated with any data source. It was extremely beneficial. However, the cost has to be reduced to complete with powerBI and Dash. Review collected by and hosted on G2.com.

Verified User in Financial Services
UF
Mid-Market(51-1000 emp.)
More Options
Validated Reviewer
Review source: G2 invite
Incentivized Review
What do you like best about Flexmonster Pivot Table & Charts Component?

Using this the Problem of less understanding with the carts got solved, With this feature it's very easy to get familiar with the most difficult part of streamlining the data. Review collected by and hosted on G2.com.

What do you dislike about Flexmonster Pivot Table & Charts Component?

It's not that much capable to hold the small databases for very large data it's perfect Review collected by and hosted on G2.com.

What problems is Flexmonster Pivot Table & Charts Component solving and how is that benefiting you?

Using excel inbuild charts and pivot tablr option there're only fixed charting formats were available but using Flexmonster it became very easy to streamline the large data and many other formatting options are also available. Review collected by and hosted on G2.com.

Verified User in Banking
UB
Enterprise(> 1000 emp.)
More Options
Validated Reviewer
Review source: G2 invite
Incentivized Review
What do you like best about Flexmonster Pivot Table & Charts Component?

Flexmonster charts and pivot tables are very useful tool business intelligence and data visualization for management for their decision making. It is very easy to use and available charts are providing useful information by data analysis. Review collected by and hosted on G2.com.

What do you dislike about Flexmonster Pivot Table & Charts Component?

Since i am using this software i did not found any dislike yet but more charts needs to included. Review collected by and hosted on G2.com.

What problems is Flexmonster Pivot Table & Charts Component solving and how is that benefiting you?

It is very difficult for us to visualize the data by using Microsoft excel and create manual charts for management decision making. But by using flexmonster it is very helpful tool by providing amazing pivort table and charts components for data analysis and summerize for presentation perspective also. Review collected by and hosted on G2.com.

Verified User in Financial Services
UF
Small-Business(50 or fewer emp.)
More Options
Validated Reviewer
Review source: G2 invite
Incentivized Review
(Original )Information
What do you like best about Flexmonster Pivot Table & Charts Component?

A powerful tool that easy-to use, simple and fast, allowing users to analyze datasets and create useful graphs Review collected by and hosted on G2.com.

What do you dislike about Flexmonster Pivot Table & Charts Component?

Nothing, except the price. Although the tool is very useful, it is quite expensive. Review collected by and hosted on G2.com.

What problems is Flexmonster Pivot Table & Charts Component solving and how is that benefiting you?

Creating charts and pivot tables to analyze data can take quite some time, this software helps shorten the duration. The user interface is similar to Excel and this makes the software very easy to use if you are already familiar with excel. The graph display quality is adequate therefore you can create graphs that can be used in reports with one click. Review collected by and hosted on G2.com.

Otandeka Simon P.
OP
Software Engineer
Small-Business(50 or fewer emp.)
More Options
Validated Reviewer
Review source: Organic
What do you like best about Flexmonster Pivot Table & Charts Component?

The drag and drop, data connectors, and data visualization tools are the best. We are able to generate reports for business analysis and management in real time. Review collected by and hosted on G2.com.

What do you dislike about Flexmonster Pivot Table & Charts Component?

Nothing much. Their software and support have been excellent. Review collected by and hosted on G2.com.

What problems is Flexmonster Pivot Table & Charts Component solving and how is that benefiting you?

Building and generating reports for business analysis and management. Finance, audit, and payroll teams love it since it makes generating ad-hoc reports easier. Review collected by and hosted on G2.com.

Kembria P.
KP
Active Member
Mid-Market(51-1000 emp.)
More Options
Validated Reviewer
Review source: G2 invite on behalf of seller
Incentivized Review
Business partner of the seller or seller's competitor, not included in G2 scores.
What do you like best about Flexmonster Pivot Table & Charts Component?

FlexMonster is one the best tool to get accurate and proper pivot tables and pivot charts. The best part of this tool is its speed of performing its job. Even if you are working in very large volumes, it will provide you with accurate and awesome tables and charts in no time. FlexMonster can extract data itself from the common data sources like MS Analysis Services, JSON, SQL tools and databases. Another amazing part of this tool is its integration your system. It supports almost all programming languages but the best fit in is JavaScript. It is highly customizable with JavaScript API, which makes it more convenient for the users to understand they can easily customize the things they want to appear on their dashboards and can use them properly without any hectic routine of finding the tool icons with the software. The user interface of FlexMonster is more like of MS excel which makes it more easier for the users as almost all of them are always familiar to the excel. Flex Monster’s ability to create 1-click report is so amazing. It can easily be integrated into to the webpages or web apps. It works amazingly on both desktop browser applications and mobile applications whether they are iOS or android. Review collected by and hosted on G2.com.

What do you dislike about Flexmonster Pivot Table & Charts Component?

One of the major drawback of this tool is its worth. It is quite expensive for the new organizations, which are new to such tools and want to automate their work. That is why most of professional users avoid this tool because of its price tag. Review collected by and hosted on G2.com.

What problems is Flexmonster Pivot Table & Charts Component solving and how is that benefiting you?

Overall, it is an amazing tool with many benefits but the price tag point of this tool outshines the pros. Review collected by and hosted on G2.com.

Matthew K.
MK
Improvement and Skills Presenter
Information Technology and Services
Enterprise(> 1000 emp.)
More Options
Validated Reviewer
Verified Current User
Review source: Organic
What do you like best about Flexmonster Pivot Table & Charts Component?

FLEXible, am able to create specific 1-click reports straight from a database onto a web page, and users can customize it even further if they like. Since it is so simple, I can create front ens to allow users to pick/ customize the data source.... This makes it even more flexible since I do not need a separate page for every single data source.

Getting a simple proof of concept to show users took only minutes Review collected by and hosted on G2.com.

What do you dislike about Flexmonster Pivot Table & Charts Component?

Hoping for more users to make comments and give ideas about things they have discovered to do with it Review collected by and hosted on G2.com.

Recommendations to others considering Flexmonster Pivot Table & Charts Component:

if you need charts, the free software is not adequate,

if on php / cloud, it is possible to extract the data, write to temp file and lower on the page dynamically read it in, so the data feed can be dynamic itself! Review collected by and hosted on G2.com.

What problems is Flexmonster Pivot Table & Charts Component solving and how is that benefiting you?

Generating so many reports that users did not originally know they wanted!

Users are happy with it an like the look which encourages them to try it further, which leads them to iscover insights on data they did not even anticipate looking for earlier Review collected by and hosted on G2.com.

Verified User in Computer Software
UC
Small-Business(50 or fewer emp.)
More Options
Validated Reviewer
Review source: Organic
What do you like best about Flexmonster Pivot Table & Charts Component?

When it comes to analysing datasets, before one even drills down into details, it is about ease of use and speed. And this is where Flexmonster excels (no pun intended, as one can obviously use Excel to create pivot tables, but this is simply no comparison when it comes to quickly dropping in large datasets) Review collected by and hosted on G2.com.

What do you dislike about Flexmonster Pivot Table & Charts Component?

Wouldn't you wish it was free?

But seriously, during my testing of CSV datasets of any size I didn't run into any problems and was able to produce the desired outputs faster than with any other tool I have used (like Webix Pivot or PivotJS) Review collected by and hosted on G2.com.

What problems is Flexmonster Pivot Table & Charts Component solving and how is that benefiting you?

To have datasets ready for analysis literally in a matter of seconds. Review collected by and hosted on G2.com.

Verified User in Computer Networking
CC
Enterprise(> 1000 emp.)
More Options
Validated Reviewer
Verified Current User
Review source: G2 invite
Incentivized Review
What do you like best about Flexmonster Pivot Table & Charts Component?

Flexibility to process pivot tables and multi-platform features. It also works great on smartphones. Review collected by and hosted on G2.com.

What do you dislike about Flexmonster Pivot Table & Charts Component?

1) 100MB limit isn't good enough, considering that Excel supports files with <=1M rows.

2) Quality of graphs is not so good as ggplot2 in R Review collected by and hosted on G2.com.

Recommendations to others considering Flexmonster Pivot Table & Charts Component:

Use this if you want to do analyze on multi-browser, multi-OS platform. Excel or Google sheets have limited features when we think about web interfaces. Review collected by and hosted on G2.com.
What problems is Flexmonster Pivot Table & Charts Component solving and how is that benefiting you?

These are mainly data analysis related on financial information--for instance, finding volatility in street prices. Benefits are reduced time to do computations and coding requirements. Review collected by and hosted on G2.com.