Best Software for 2025 is now live!
Show rating breakdown
Save to My Lists
Claimed
Claimed

Top Rated AnyChart JS Charts Alternatives

AnyChart JS Charts Reviews & Product Details

Verified User in Computer Software
UC
Small-Business(50 or fewer emp.)
More Options
Validated Reviewer
Review source: G2 invite
Incentivized Review
What do you like best about AnyChart JS Charts?

Well I love JavaScript, so maybe I am a bit bias, but it is super easy to use and produces great charts/graphs. Review collected by and hosted on G2.com.

What do you dislike about AnyChart JS Charts?

The support can be a bit better, but I still like the product. And I mean, if I am being honest, if you are a good enough JavaScript developer you can do what this tool does on your own. Review collected by and hosted on G2.com.

What problems is AnyChart JS Charts solving and how is that benefiting you?

I am visualizing data with AnyChart. It is very helpful to complete such a task. Review collected by and hosted on G2.com.

AnyChart JS Charts Overview

What is AnyChart JS Charts?

AnyChart is an award-winning JavaScript charting library from the world's leader in data visualization, which makes it easy for developers to add beautiful interactive charts and dashboards to any web, mobile, or standalone project. AnyChart is flexible, lightweight, cross-platform and cross-browser, with outstanding documentation and API reference. Provides over 70 built-in chart types and numerous features out of the box. Runs on any platform and with any database. Prompt support guaranteed. More than 75% of Fortune 500 companies across all industries and over half of the top 1,000 software vendors worldwide use AnyChart to operate data visualization in their business intelligence, reporting and analytics systems. Join the leaders!

AnyChart JS Charts Details
Languages Supported
German, English, French, Italian, Japanese, Korean, Dutch, Polish, Portuguese, Russian, Spanish, Swedish, Turkish, Chinese (Simplified), Chinese (Traditional)
Show LessShow More
Product Description

AnyChart JS Charts is a flexible, cross-platform and cross-browser JavaScript charting library that allows you to add interactive HTML5 charts and dashboards to any web projects. AnyChart supports numerous common JS charts including line, spline, area, column, bar, pie, donut, scatter, sparkline, circular gauges, area-spline-range, column-range, bubble, box plot, error bars, funnel, waterfall, radar, polar, and many other types of charts.


Seller Details
Seller
AnyChart
Year Founded
2003
HQ Location
Saint Augustine, FL
Twitter
@AnyChart
6,494 Twitter followers
LinkedIn® Page
www.linkedin.com
18 employees on LinkedIn®
Phone
1(888) 845-1211

Andrey K.
AK
Overview Provided by:
Communications @ AnyChart

Recent AnyChart JS Charts Reviews

Verified User
U
Verified UserMid-Market (51-1000 emp.)
4.5 out of 5
""Very easy to depict data""
This is the best software used as a visualization tool for both mobile and web applications. The best thing which i like the most is it support man...
Sunil T.
ST
Sunil T.Mid-Market (51-1000 emp.)
4.5 out of 5
"Anychart- Data visualization in different format (series, pie, area, bar etc.)"
Easy to use and flexible charting library API. Good enough for creating interactive charts and we can integrate same on different technology projec...
Verified User
U
Verified UserSmall-Business (50 or fewer emp.)
4.0 out of 5
"AnyChart is Actually Pretty Great"
Well I love JavaScript, so maybe I am a bit bias, but it is super easy to use and produces great charts/graphs.
Security Badge
This seller hasn't added their security information yet. Let them know that you'd like them to add it.
0 people requested security information

AnyChart JS Charts Media

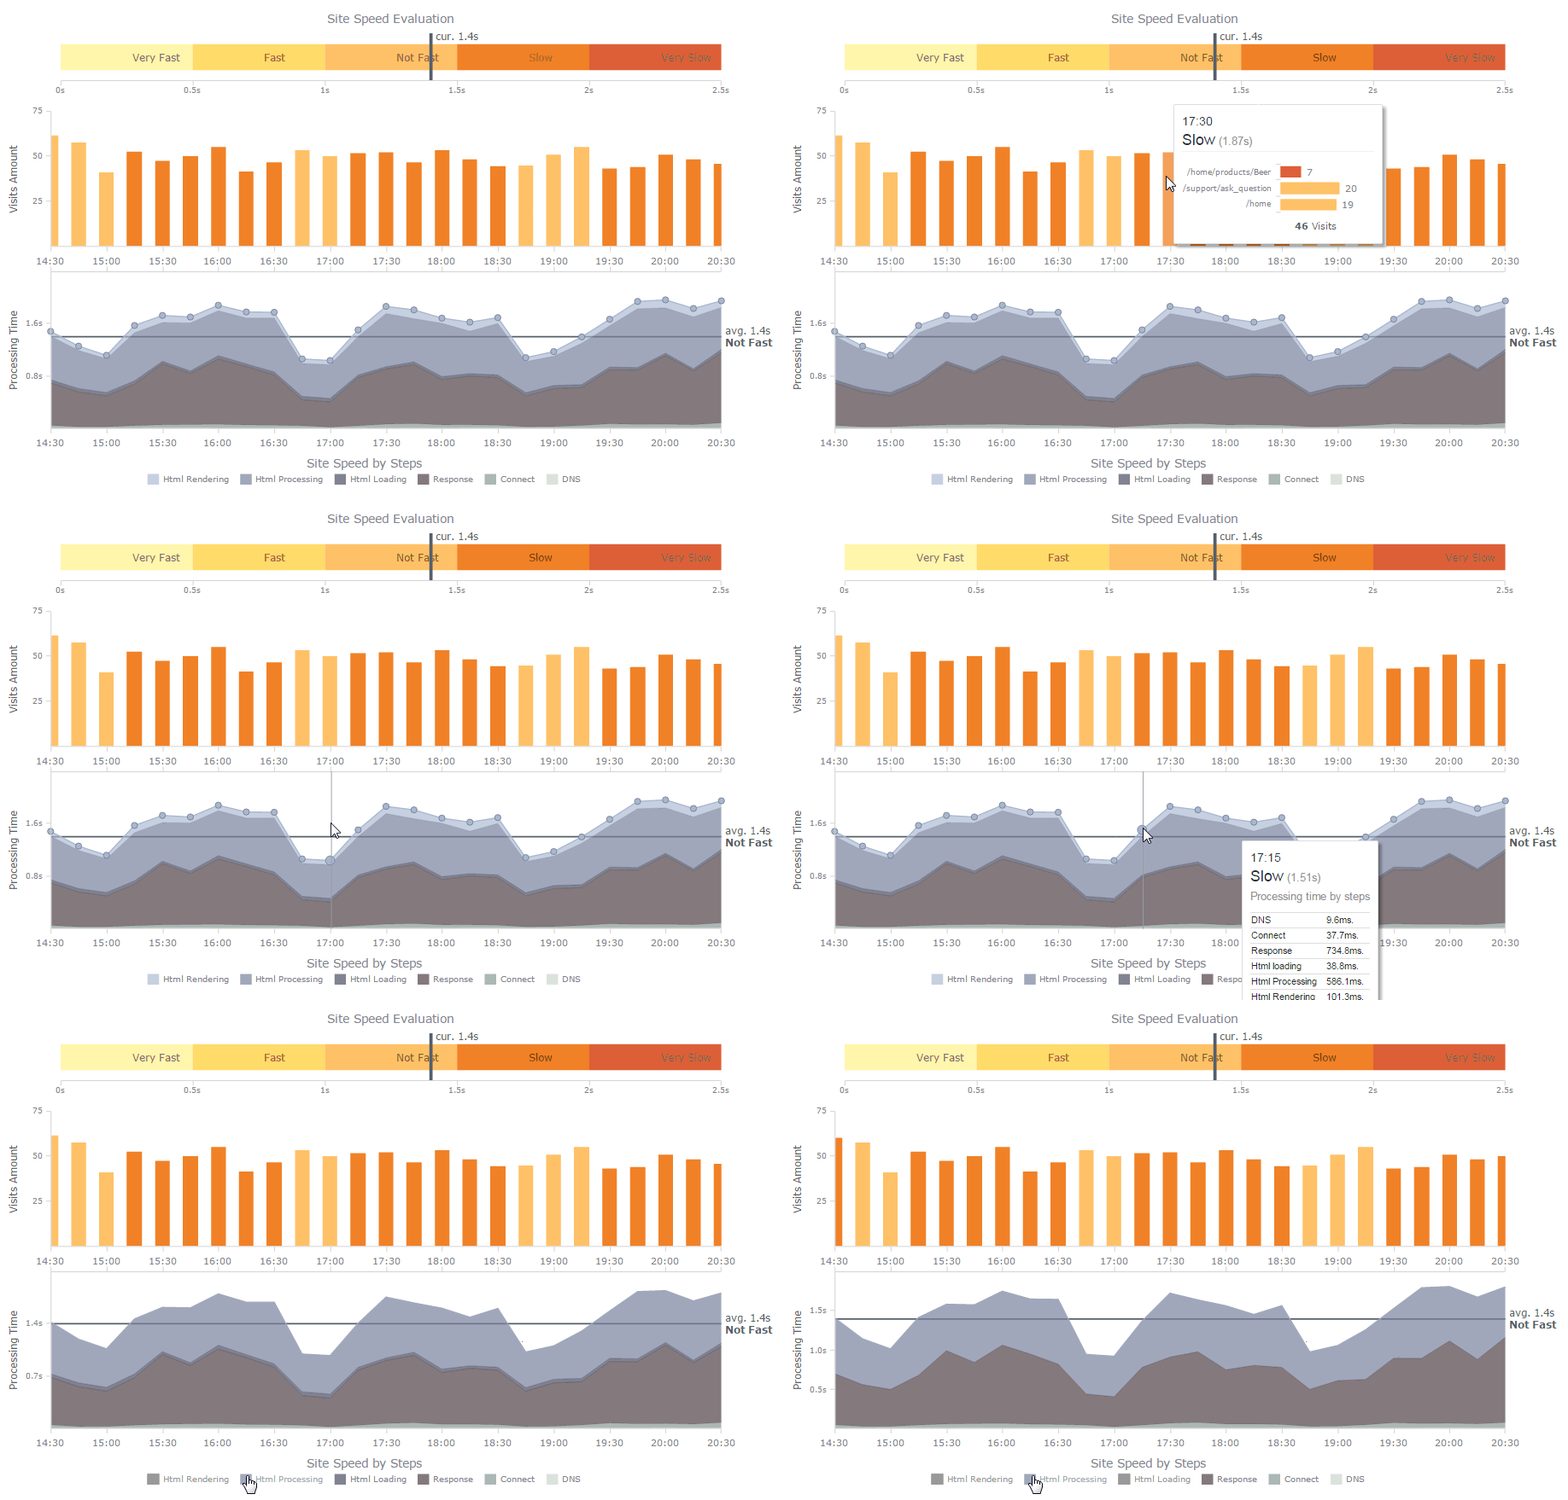
AnyChart JS Charts Demo - Website Performance Dashboard
Website Performance Dashboard
AnyChart JS Charts Demo - Sunburst Chart
Sunburst Chart
AnyChart JS Charts Demo - Waterfall Chart
Waterfall Chart
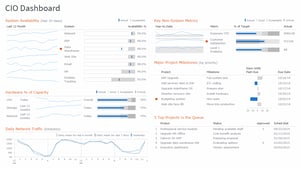
AnyChart JS Charts Demo - CIO Dashboard
CIO Dashboard
AnyChart JS Charts Demo - Error Bars
Error Bars
AnyChart JS Charts Demo - Combo Chart - Pareto Chart
Combo Chart - Pareto Chart
Answer a few questions to help the AnyChart JS Charts community
Have you used AnyChart JS Charts before?
Yes

13 out of 14 Total Reviews for AnyChart JS Charts

4.3 out of 5
The next elements are filters and will change the displayed results once they are selected.
Search reviews
Popular Mentions
The next elements are radio elements and sort the displayed results by the item selected and will update the results displayed.
Hide FiltersMore Filters
The next elements are filters and will change the displayed results once they are selected.
G2 reviews are authentic and verified.
Sunil T.
ST
Associate Group Lead
Mid-Market(51-1000 emp.)
More Options
Validated Reviewer
Verified Current User
Review source: G2 invite
Incentivized Review
What do you like best about AnyChart JS Charts?

Easy to use and flexible charting library API. Good enough for creating interactive charts and we can integrate same on different technology project. Data rendering is very quick. This supports multiple chart formats and languages.

This is good enough to extract and show the data of complicated logics and dynamic objects data as well. Also supports XML, JSON etc. format data.

During zoom in and out chart quality is excellent. Using it's tooltip and legend it allows to show additional information on the chart. Review collected by and hosted on G2.com.

What do you dislike about AnyChart JS Charts?

So far so good nothing to dislike about this charting library. Review collected by and hosted on G2.com.

Recommendations to others considering AnyChart JS Charts:

A lightweight charting api, highly responsive in case of data rendering regardless of data size. This can render more than 20000 points.

Performance wise good enough. Review collected by and hosted on G2.com.

What problems is AnyChart JS Charts solving and how is that benefiting you?

Created charts for large scale data review. Analysed charts data statstics with simplicity. Review collected by and hosted on G2.com.

Saurabh S.
SS
Sr. Software Engineer 2
Enterprise(> 1000 emp.)
More Options
Validated Reviewer
Verified Current User
Review source: G2 invite
Incentivized Review
(Original )Information
What do you like best about AnyChart JS Charts?

This library works fine on cross platform and browsers. Graphical data scaling is simple and we are easily able to create different types of graphs (like pie, bar, column etc.) according to project requirement.

Auto resize - Chart gets resized automatically according to browser window size.

During chart loading data transformation, rendering is pretty much faster and highly responsive.

Graphical data representation and visualisation is seamless.

It's animation feature is very efficient we can add the same on charts without writing any custom code, just need to use the pre defined tags for implementation.

To add the additional details on graph we can use caption, tooltips, label etc.

Has an option to save the graph as image. Review collected by and hosted on G2.com.

What do you dislike about AnyChart JS Charts?

Did not find any issue. This charting library is good enough to create advanced and interactive charts. Review collected by and hosted on G2.com.

Recommendations to others considering AnyChart JS Charts:

Yes i recommend for this. It's an easy to use and requires less development efforts to create the charts. Review collected by and hosted on G2.com.

What problems is AnyChart JS Charts solving and how is that benefiting you?

Efficiently created dashboard module and summary charts for complex and high volume data. Easily able to review and analyse the large scale data.

Overall easy to use and we need to write up less code to make the interactive and informative graphs. Review collected by and hosted on G2.com.

Verified User in Computer Software
UC
Mid-Market(51-1000 emp.)
More Options
Validated Reviewer
Review source: G2 invite
Incentivized Review
What do you like best about AnyChart JS Charts?

This is the best software used as a visualization tool for both mobile and web applications. The best thing which i like the most is it support many languages which helps the users to apply it with many applications developed through many languages. Review collected by and hosted on G2.com.

What do you dislike about AnyChart JS Charts?

Data like minimum and maximum value ranges of the charts need to provide correctly unless those data are correctly provided. Review collected by and hosted on G2.com.

Recommendations to others considering AnyChart JS Charts:

Highly recommended. Review collected by and hosted on G2.com.

What problems is AnyChart JS Charts solving and how is that benefiting you?

Its very helpful for used as a data visualization tool. Its support many languages and can ve used with any opening system. Review collected by and hosted on G2.com.

RU
Mid-Market(51-1000 emp.)
More Options
Validated Reviewer
Review source: G2 invite
Incentivized Review
What do you like best about AnyChart JS Charts?

I like that it to implement the data charts, easy to use, the data visualization are very nice, and the user has the options of customizing , changing the width and resizing the charts. I like that you can interface with other computer language using Anycharts Review collected by and hosted on G2.com.

What do you dislike about AnyChart JS Charts?

I did not like that you could export the data from the platform, and that it was difficult to determine the amount of data need to depict the chart like scatter plot. Review collected by and hosted on G2.com.

What problems is AnyChart JS Charts solving and how is that benefiting you?

I can solve problems by implementing data used from Anycharts graphic to help support the language from other application to help development to other languages. Review collected by and hosted on G2.com.

Saurabh S.
SS
Sr. Software Engineer
Enterprise(> 1000 emp.)
More Options
Validated Reviewer
Review source: G2 invite
Incentivized Review
What do you like best about AnyChart JS Charts?

Easy to use, cross platform and lightweight char library. Seamless implementation in different technology projects.

Fast data rendering regardless of data size even it's pretty efficient in case of huge data amount.

Chart quality is amazing. This supports multiple languages as well. Data visualisation is very easy.

We can easily create different type of charts like pie, line, bar, area, histogram etc. according to requirement.

Performance wise API is good enough. Review collected by and hosted on G2.com.

What do you dislike about AnyChart JS Charts?

So far did not face any technical glitch in this API. Easy and quick way for chart implementation. Charts look and feel is awesome without any custom code. Review collected by and hosted on G2.com.

Recommendations to others considering AnyChart JS Charts:

Yes. This API is good enough to extract the static and dynamic data in chart format and works well in case of complex calculation as well. Review collected by and hosted on G2.com.

What problems is AnyChart JS Charts solving and how is that benefiting you?

We have created dashboards and summary charts to review and analyse the latest and historical data.

Reporting and data visualisation is very quick.

Data calculation and filtration is easy to customize. Review collected by and hosted on G2.com.

Devika P.
DP
Sr. Application Engineer
Computer Software
Enterprise(> 1000 emp.)
More Options
Validated Reviewer
Verified Current User
Review source: G2 invite
Incentivized Review
(Original )Information
What do you like best about AnyChart JS Charts?

This is lightweight, cross platform and cross browser compatible. Enriched with several inbuilt features.

It allows me to create beautiful charts, dashboard and reports easily. Data rendering is pretty much smooth. This supports numerous data types and languages. It allows to change the visual representation of data as per requirement and i can customize chart's theam, streaming point and time, data points etc.

For instruction purpose legends can be added on charts.

Charts resizing is smooth according to client's window size. Its layer feature allows to create multiple layers on single chart like First Quarter, Second Quarter etc. So this gives an opportunity to review multiple layers data in a single chart.

Charts can be exported in multiple formats like image, pdf etc.

Anychart library documentation is well organized. Review collected by and hosted on G2.com.

What do you dislike about AnyChart JS Charts?

Pricing model for internal application is bit high but still worth of use. Review collected by and hosted on G2.com.

Recommendations to others considering AnyChart JS Charts:

Robust and reliable tool for data visualization. Review collected by and hosted on G2.com.

What problems is AnyChart JS Charts solving and how is that benefiting you?

Performing data analysis in real time. Analyzing huge amount of data with simplicity. Improved data visualization capabilities. Review collected by and hosted on G2.com.

Sunil S.
SS
Software Engineer
Computer Software
Mid-Market(51-1000 emp.)
More Options
Validated Reviewer
Verified Current User
Review source: G2 invite
Incentivized Review
(Original )Information
What do you like best about AnyChart JS Charts?

AnyChart library is a lightweight and cross platform compatible. It's pretty much flexible and quickly customizable according to project requirements.

It's enrich with several inbuilt features which are helpful during chart implementation. On charts easily able to set the ratio, range, zoom, point limit , orientation etc.

Graphical data rendering is pretty much fast er and responsive. It allows to show any type of data on charts.

Chart implementation is easy and does not require much efforts. This supports wide range of chart types (like Gantt, Pie, Bar, 3D Bar, Stock charts etc.). In AnyChart different type of themes and plugins are available. Allows to export the chart image / data in pdf, csv, excel, xml formats.

This supports multiple languages. Review collected by and hosted on G2.com.

What do you dislike about AnyChart JS Charts?

So far nothing to dislike. Overall it's pretty much efficient and smart API. Review collected by and hosted on G2.com.

Recommendations to others considering AnyChart JS Charts:

Yes, its an efficient solution for data representation and visualization. Review collected by and hosted on G2.com.

What problems is AnyChart JS Charts solving and how is that benefiting you?

Created interactive dashboards and improved the reporting system. Easily able to review the large scale data with graphical and chart representation. Review collected by and hosted on G2.com.

Verified User in Computer Software
AC
Small-Business(50 or fewer emp.)
More Options
Validated Reviewer
Verified Current User
Review source: G2 invite
Incentivized Review
What do you like best about AnyChart JS Charts?

AnyChart is a blazingly fast, comprehensive data visualization tool and JavaScript charting library designed to simplify the integration of beautiful charts into any device, platform, or application. It comes with an awesome API functionality, documentation tools, and enterprise-grade support. Review collected by and hosted on G2.com.

What do you dislike about AnyChart JS Charts?

Learning time is quite high with AnyChart. Review collected by and hosted on G2.com.

What problems is AnyChart JS Charts solving and how is that benefiting you?

Visualize complex long-range weather forecasts and weather maps for Meteomedia AG, making it possible to compare different weather models at a glance. Review collected by and hosted on G2.com.

Verified User in Civic & Social Organization
UC
Small-Business(50 or fewer emp.)
More Options
Validated Reviewer
Review source: G2 invite
Incentivized Review
What do you like best about AnyChart JS Charts?

Its simple and the configuration Its easy and quickly Review collected by and hosted on G2.com.

What do you dislike about AnyChart JS Charts?

Theres no documentation for projects on angular Review collected by and hosted on G2.com.

What problems is AnyChart JS Charts solving and how is that benefiting you?

I just usted yo show the data of proyects Review collected by and hosted on G2.com.

Verified User in Management Consulting
CM
Enterprise(> 1000 emp.)
More Options
Validated Reviewer
Review source: G2 invite
Incentivized Review
Business partner of the seller or seller's competitor, not included in G2 scores.
What do you like best about AnyChart JS Charts?

It was very easy to integrate. It provided us with the required acceleration to implementation. Review collected by and hosted on G2.com.

What do you dislike about AnyChart JS Charts?

No particular reason to dislike. The partners with their enablement app was Review collected by and hosted on G2.com.

What problems is AnyChart JS Charts solving and how is that benefiting you?

Used for partner enablement learning app . Brought live dashboards w Review collected by and hosted on G2.com.