


What are Gantt charts?
A Gantt chart is a visual project management tool, similar to a bar chart, commonly used to illustrate project tasks over some time. Gantt charts typically include an outlined list of tasks on the left side and horizontal bars of different lengths to represent the task completion over time. Project managers and other industry professionals may refer to Gantt charts as a project roadmap.
Teams across industries use project management tools for visualization, planning, and reporting. In general, project management tools complement project management software as project management tools are not meant to manage projects fully from beginning to end.


Where do Gantt charts come from?
Gantt charts get their name from Henry Gantt (1861-1919), a mechanical engineer and management consultant, who designed the Gantt chart between 1910 and 1915 to measure employees' productivity levels. Gantt charts were used during major infrastructure projects, including the Hoover Dam in the 1930s.
Basic elements of Gantt charts
Gantt chart software help project teams visualize project tasks and timelines for those tasks. Additionally, Gantt charts may include additional details about the work, including:
- Name and details: All assignments should have a clear title that all team members will understand. Some tools include functionality that allows teams to include task details for further clarification. It may also be beneficial to have the priority of each task within the detail notes.
- Owner: Indicating who is responsible for which task allows project team members to hold each other accountable for the work they must complete. It also gives individuals a reference to go back to when they need to confirm their responsibilities as part of a specific project.
- Dependencies: Not only do Gantt charts display the complete project timeline from start to end, but they also show dependencies between tasks. Incorporating task dependencies helps teams understand the order of project logistics and makes teams aware that dependent tasks likely need to be rescheduled.
- Due dates: Adding due dates for each task within the broader project timeline helps ensure the project moves at the desired pace. It can also help compare planned task completion versus actual time spent to forecast future project work better.
- Percentage complete: In some cases, team members may enter an estimated percentage completion rate to tell others where they are at with the task.
Benefits of Gantt charts
Gantt charts are easy-to-use tools that offer many benefits to project teams, including:
- A high-level overview of a project for various stakeholders: A Gantt chart provides an overall view of a project without diving into the weeds. It’s a helpful timeline for many key stakeholder groups, including the direct project team, the project sponsors, and executive stakeholders.
- Improved project tracking and resource planning: Gantt charts enable project leads to closely track the overall workflows and tasks within a project in one centralized place. The visual layout helps reveal possible constraints, scheduling issues, and inefficient resource allocation, allowing leaders to mitigate these problems before the project falls behind.
- Increased alignment amongst team members: When project teams use tools like Gantt charts, everyone has access to the same level of information, creating a foundation for alignment. With a shared understanding of the work, team members can have better conversations around timelines and accountability.
Drawbacks of Gantt charts
A Gantt chart can be a helpful tool for project teams, but as with all tools, there are some potential drawbacks. They include:
- Potentially time-consuming to set up and update regularly: Setting up a Gantt chart for a highly complex project requires time and planning. Teams already on a tight timeline may not have additional time to invest in setting up a Gantt chart. Additionally, there are many ways to set up a Gantt chart; however, without a software tool, Gantt charts require manual updating.
- A lack of prioritization: Gantt charts present tasks within a project in order of completion based on dependencies and an estimate of how long each task will take. They don’t reveal the priority of tasks outside the relationship between dependencies. Team members might not understand the highest priority tasks unless clearly stated.
- High complexity can lead to confusion: Gantt charts for large, highly complex projects with many tasks and subtasks can be challenging to read. Too many tasks and subtasks can create more confusion than clarity, depending on how the Gantt chart is structured.
Steps to create a Gantt chart
Whether setting up a Gantt chart using a software program or creating one manually in a spreadsheet tool, there are some steps project managers should follow.
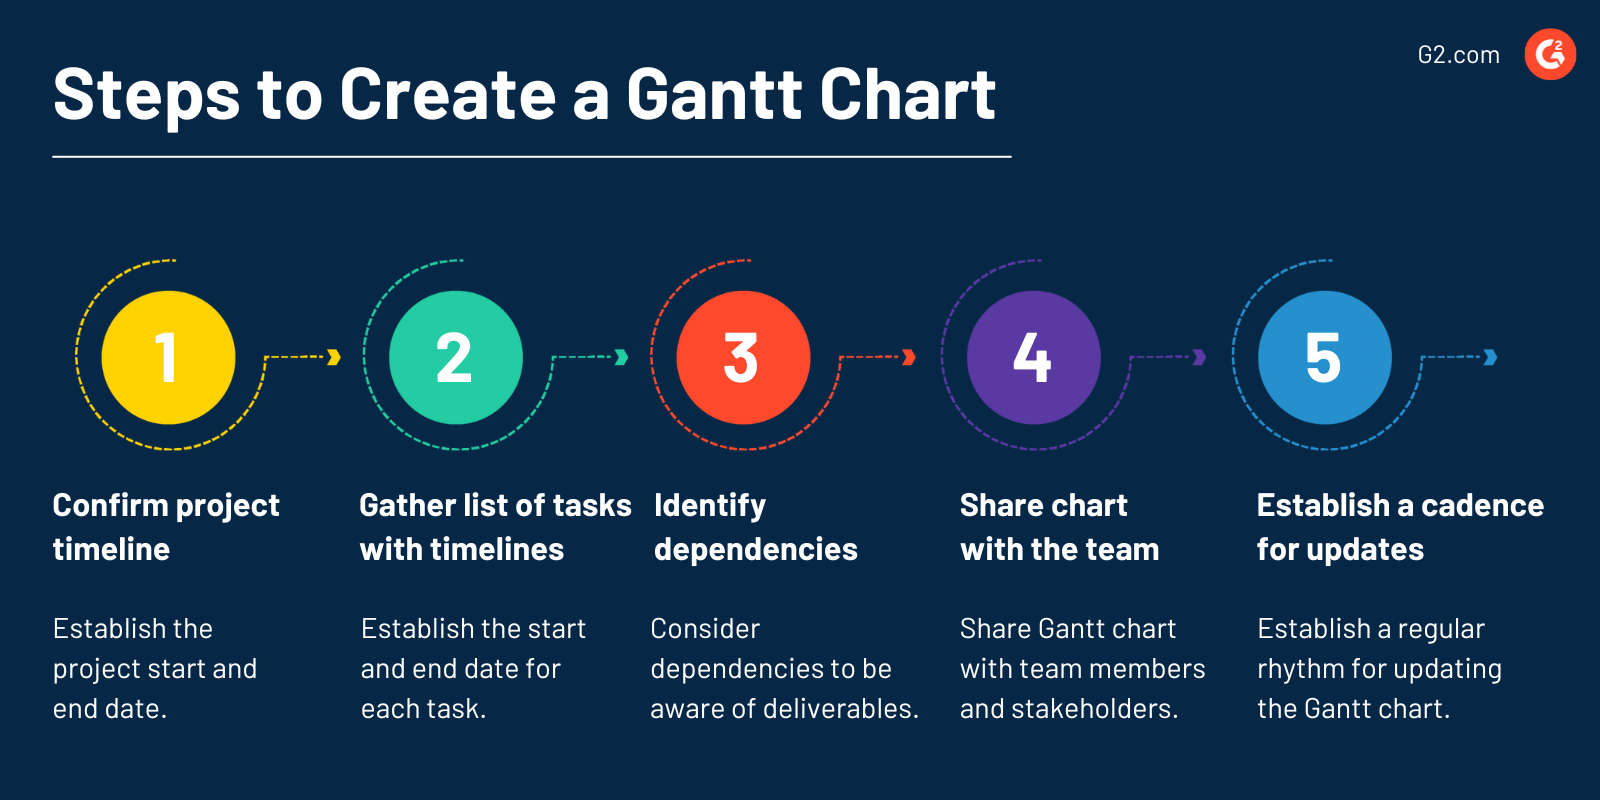
The steps for creating an effective Gantt chart are:
- Confirming the timeline for the project: Gantt charts display a project from start to finish, which means project managers must first establish and solidify the beginning and end date of the project. Ensuring that all project team members are aligned with the timeline is an essential part of this process.
- Gathering a complete list of tasks and subtasks with estimated timelines: Project managers may be able to pull a list of project tasks from other planning documents; however, they should also ensure each task has a start and end date associated with it. Precise start and end dates provide a better visual and convey to team members when they should work on specific tasks.
- Identifying and capturing dependencies: Drawing dependencies between tasks helps teams stay aware of how their deliverables impact others and the project's overall completion. Project managers should work with the project team to outline and capture all dependencies to include them in the Gantt chart.
- Sharing the Gantt chart with the team: Once the Gantt chart is complete, the project manager or team lead should share it with all necessary stakeholders for easy access. Project managers or team leads should walk through the Gantt chart with the team to ensure everyone understands how to use it throughout the project.
- Establishing a cadence for Gantt chart updates: Project timelines will inevitably change more often than not. Project managers must establish a regular rhythm for updating the Gantt chart to ensure team members know about changes and can adapt to keep the project on track.
Gantt charts vs. PERT charts
Project managers use Gantt and Program Evaluation and Review Technique (PERT) charts to monitor project tasks and status.
A Gantt chart displays tasks and timelines in a bar graph format for a high-level overview of the project from start to end.
A PERT chart shows tasks in a network diagram format to show dependencies to other tasks. The most significant difference between these tools is that a Gantt chart includes an x-axis to represent the project timeline, and a PERT chart does not include an axis to represent time.
Keep projects on track. Understand how project risk management helps teams fail-proof projects.

Alyssa Towns
Alyssa Towns works in communications and change management and is a freelance writer for G2. She mainly writes SaaS, productivity, and career-adjacent content. In her spare time, Alyssa is either enjoying a new restaurant with her husband, playing with her Bengal cats Yeti and Yowie, adventuring outdoors, or reading a book from her TBR list.


")


