
In this growing competitive digital world, where companies compete for user attention and time, tracking website traffic is essential for businesses to collect the necessary data to understand how visitors interact with their websites. Capturing how potential customers navigate a website has been an integral part of heatmap tools. These tools are important for usability testing to optimize websites and engage visitors.
As the use of mobile devices has exponentially increased, so has the development of mobile apps, creating a larger need for heatmap tools that track mobile app users. In October 2022, G2 launched an attribute to the Heatmap Tools category called Device Type. This new attribute categorizes this software based on its ability to work with websites, mobile apps, or both. Now, customers can compare and buy heatmap tools based on their web or mobile needs.
Website vs. mobile app heatmap tools
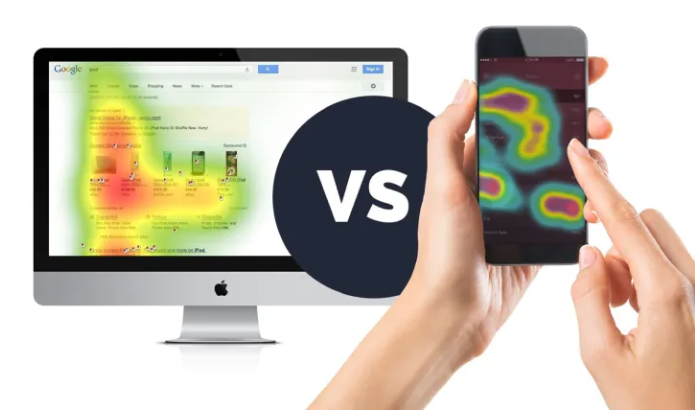
Source: zhuanlan.zhihu
Mobile app heatmap tools, also known as touch heatmaps, are similar to website heatmaps. However, instead of tracking user click data, it tracks touch behavior and overlays visual heatmaps onto screenshots of mobile app interfaces. This provides businesses with behavioral information on how mobile app visitors use their fingers to tap, zoom, pinch, scroll, etc., on different screens of their mobile app.
Like website heatmaps, the most engaging spots where users spend their time are red, representing warmth, and the least engaging spots are blue, representing the cold. Additionally, the range of colors between hot red and cold blue displays the average user engagement. This provides the necessary visual data that depicts how a user navigates the mobile app and where they spend their time.
| TIP: Mobile app heatmaps are often referred to as touch heatmaps since they track and save the different gestures and finger motions used to interact with each mobile app interface. These gestures are crucial for product analytics or UX/UI teams to monitor; whether it’s as simple as single taps and scrolls or more complex like zooming in or long holds, all motions provide viable behavioral data on how a user experiences a mobile app. |
History of heatmaps
Heatmaps have come a long way since their debut in the late 1800s as 2D data matrices displaying various shades of black, white, and gray. During this time, using color to display numbers in a table emerged as a powerful statistical technique, first notably implemented by French economist Toussaint Loua. He used colors and shadings to understand the changes within the French population during a census in the late 19th century.
As heatmaps continued to grow in popularity and advance, it wasn’t until the late 1990s that the term was officially coined by Cormac Kinney, who was attributed to inventing the first heatmap software implemented within the financial industry. He created software that inputted large amounts of financial data from traders' screens, processed changes within the fluctuating market, and displayed real-time market updates. This data was then visually represented by heatmaps– where the reds and blues would display the downward and upward trends of the market throughout the course of the trading day. This revolutionized the industry for traders, as it was faster to spot changes in colors compared to the traditional way of calculating and comparing numerical data.
Fast forward to today, heatmap tools are primarily used by marketers, UI/UX designers, product analytic teams, and web developers to enhance and optimize the user experience for web and mobile app users. More heatmap tools are expanding to include mobile app functionality as well.
The pie chart below showcases the current software breakout of each attribute within the Heatmap Tools category since the launch of the Device Type attribute in October 2022.
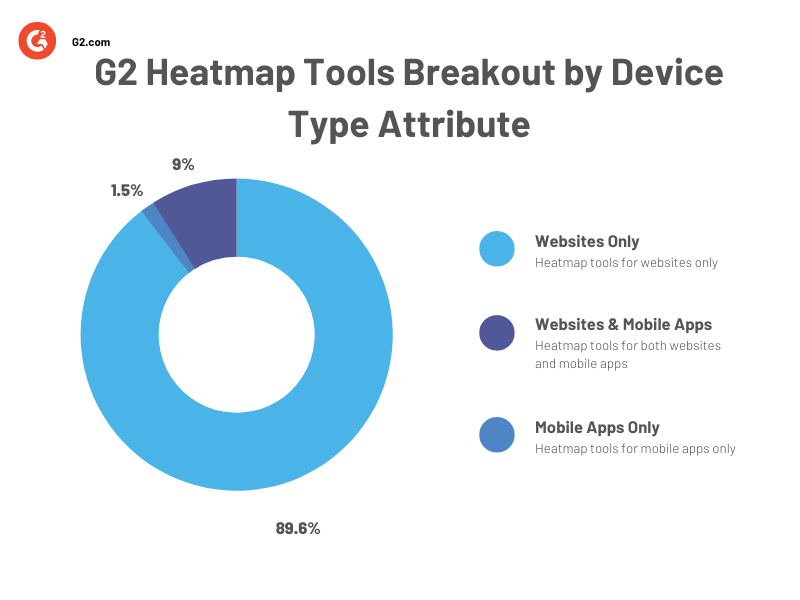
As depicted above, an overwhelming majority of the heatmap tools in G2’s are for websites only (90%) as of November 2022. While we can expect more mobile app heatmap tools to enter the market, it is safe to assume that it would be a supplementary function added to the heatmap software for websites.
Three ways mobile heatmap tools will increase app engagement:
- Send out push notifications: This software can help marketers or salespersons analyze the success of their push notifications. It can provide integral information by evaluating how users interacted with a landing screen, determining where their time was spent, and gauging interest in the push notifications.
- Determine drop-off points: UX/UI design and product analytic teams can use this software to reveal various bottlenecks within the mobile experience. Mobile heatmaps can uncover where a customer left your app and what screen they exited. Cart abandonment is a common e-commerce issue, and this software can help identify the different usability problems that users experience that contribute to the drop-off.
- Reveal UI issues: Whether your app is suffering from broken links, confusing content, or navigational difficulties, mobile heatmap tools can aid UX/UI design teams by determining recurring barriers with the UI, allowing UX teams to create the necessary solutions.
Leveraging mobile app heatmap tools with other software to maximize conversions
The intended goal of using heatmaps is to optimize engagement to increase conversion rates. To do this, app owners should use mobile app heatmaps in tandem with additional conversion rate optimization software, like session replay and product analytics software, to maximize this outcome.
Users can unlock a new level of analytics when they pair mobile heatmaps with session replay software. This symbiotic dynamic between mobile heat maps and mobile session replay software works together to display visual recordings of mobile app user interactions depicted as a transforming heatmap across various mobile screens. This software combination is remarkably effective as you can watch each session and tag and replay specific events of importance.
Overall, mobile app heatmap software can add to your analytical arsenal of optimization software. It is a necessary tool for any business with a mobile app that wants to maintain and grow its users and stay ahead of the competition.
Choosing the right software for your business
When purchasing heatmap software, buyers should determine if their product will be strictly web-based or if there will be a mobile app version. If buyers currently just use a website to host their software, they may just need a standard heatmap software with web capabilities, which there is a plethora to choose from.
On the other hand, heatmap tools with mobile app capabilities tend to have many more features to uncover UX insights from varying mobile devices and robust mobile app analytics. Although there isn’t a large selection of heatmap tools that function for both websites and mobile apps, it is a safe choice for businesses that plan to launch a mobile app in the future.
Edited by Jigmee Bhutia
Vous voulez en savoir plus sur Outils d'analyse des applications mobiles ? Découvrez les produits Analyse des applications mobiles.

Alanna Iwuh
Alanna is a Market Research Analyst at G2 specializing in marketing software. She is passionate about market research and data-driven insights and is fascinated by psychology and human behavior. She also serves as a co-lead of the Ebony & Allies ERG at G2. In her free time, Alanna is somewhere traveling the world, shopping at farmer’s markets, or admiring art.

