What is regression analysis?
Regression analysis estimates relationships or links between a dependent variable and one or more independent variables. It assesses the connection’s strength and potential for future relationships.
It comprises various forms, including linear, multiple linear, and nonlinear regression. Simple linear and multiple linear regression are the most common models. Nonlinear regression, on the other hand, is applied when dealing with complex datasets exhibiting a nonlinear association between the dependent and independent variables.
Many professionals prefer using regression analysis to predict accurate business outcomes when a business proposal relies on multiple factors. Most executives turn to statistical analysis software to perform these evaluations.


Types of regression analysis
The regression analysis technique and approach selection rely on multiple factors, such as the type of dependent variable and the number of independent variables. Below are a few common types of regression analysis.
- Simple linear regression analysis is employed to forecast the value of a dependent variable based on the known value of an independent variable. The method fits a straight line, allowing it to define the relationship between the two variables by estimating the coefficients in the linear equation.
- Multiple regression analysis describes a response variable with the help of multiple predictor variables when the connections between data are more intricate. This approach works best when strong correlations among the independent variables can impact the dependent variable.
- Ordinary least squares regression is a method that estimates unknown parameters in a model. It calculates a linear regression equation’s coefficient by lessening the sum of squared errors between the actual and predicted values a straight line represents.
- Polynomial regression, a form of multiple linear regression, comes into play when the relationship between data points is nonlinear. It determines the curvilinear relation between independent and dependent variables.
- Logistic regression models the dependent variable’s probability based on independent variables. It is used when the dependent variable can take one of a limited set of binary values (0 and 1), making it suitable for binary data analysis.
- Bayesian regression is applied when datasets are limited or poorly distributed. When data is unavailable, it uses a probability distribution to derive output instead of point estimates.
- Quantile regression estimates specific percentiles or quantiles of a response variable rather than focusing solely on the conditional mean, as in linear regression. It resists the outlier’s influence and doesn't rely on assumptions.
- Ridge regression is a regularization technique that mitigates multicollinearity among independent variables or when the number of independent variables surpasses the number of observations. Multicollinearity is a statistical concept wherein several independent variables in a model are correlated.
Benefits of regression analysis
Utilizing regression analysis to assess the impact of changing variables offers several advantages for businesses.
- Making data-driven decisions. When planning for the future, businesses rely on regression analysis to determine which variables significantly influence outcomes.
- Recognizing opportunities to improve. Companies can observe how increasing the number of people on a project affects revenue growth. Regression analysis reveals relationships between variables, empowering businesses to identify improvement opportunities.
- Optimizing business processes. Businesses use regression analysis to enhance operational efficiency. For example, conducting consumer surveys before launching a new product line helps them understand how various factors impact production.
How to conduct regression analysis
Conducting linear regression involves several key steps to compute the relationship between a dependent variable and one or more independent variables.
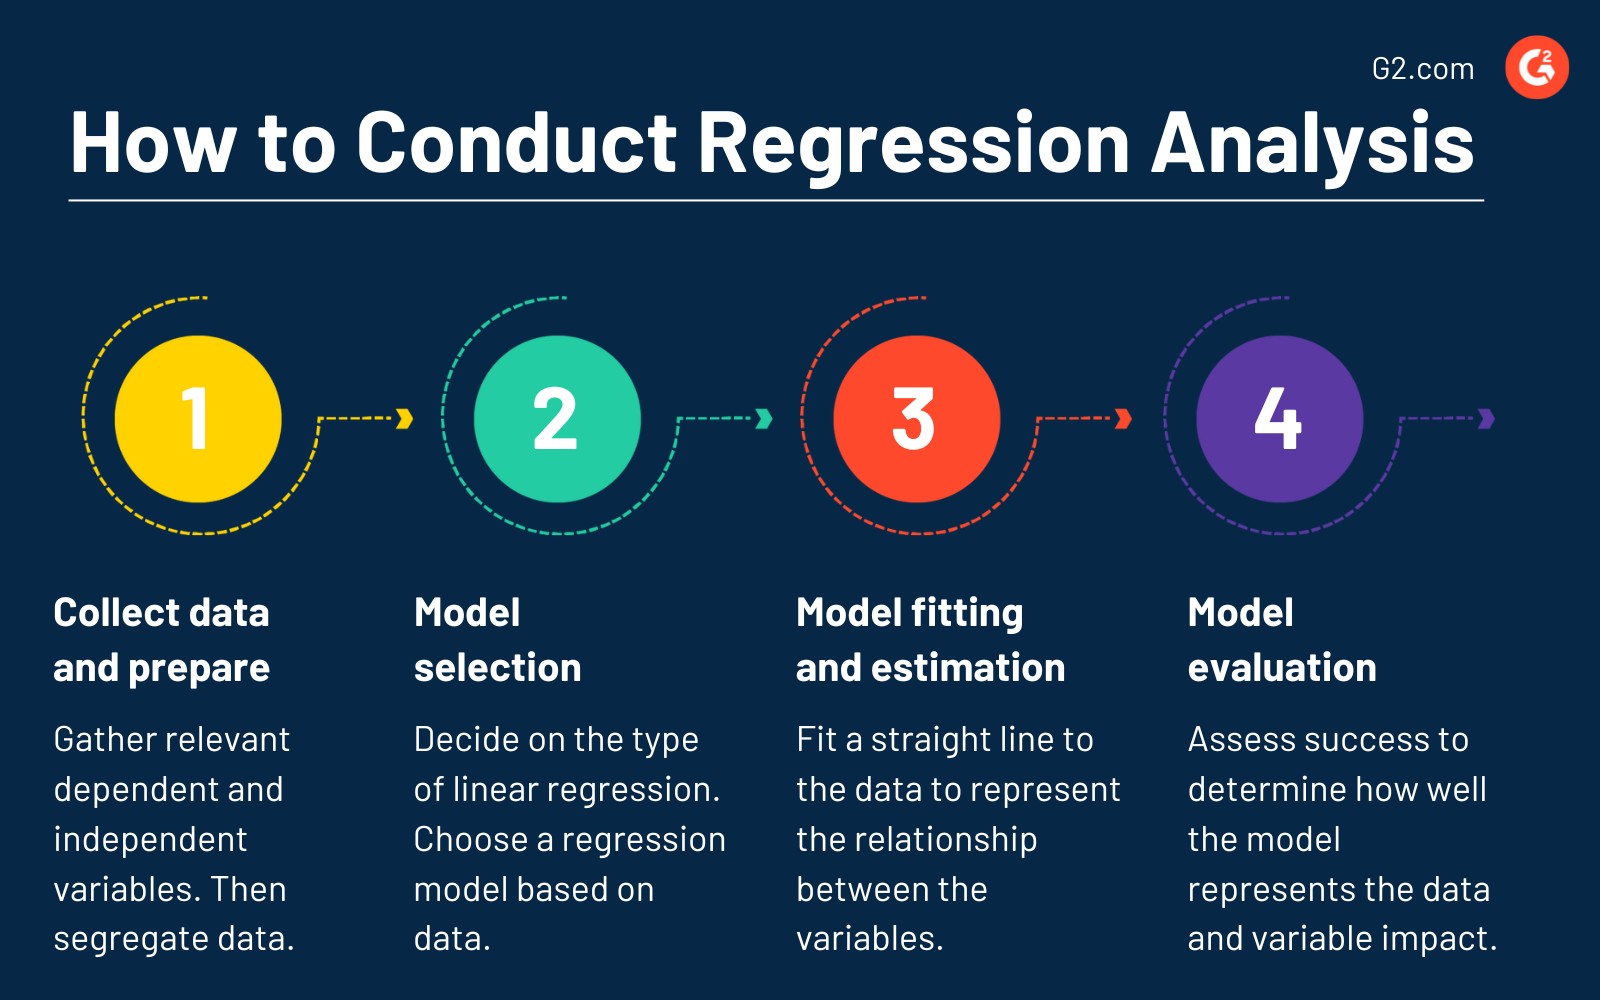
Here are the main points to follow:
- Data collection and preparation. Gather relevant dependent and independent variables. Ensure there are no missing values and check for outliers that may impact the analysis results. Segregate data into training and test sets to assess the model’s performance.
- Model selection. Decide on the type of linear regression. Choose the appropriate regression model based on data characteristics.
- Model fitting and coefficient estimation. In simple linear regression, fit a straight line to the data that best represents the relationship between the dependent and independent variables. Conversely, estimate linear equation coefficients to determine independent variables’ influence on dependent variables for multiple linear regression.
- Model evaluation. Assess success to determine how well the model represents the data. Analyze the significance of the regression coefficients to understand the impact of each independent variable on the dependent variable.
Regression analysis best practices
Below are some essential best practices to ensure predictions and outcomes are close to actuals.
- Keep test suites updated. Make sure to verify the functionality of old features with new upgrades.
- Utilize regression testing framework. Employ regression testing frameworks to streamline maintenance efforts.
- Adapt test designs. This should be determined by the developers' and testers’ needs.
- Implement automated regression testing. Save resources and expedite delivery through automated regression testing.
- Identify bugs before deployment. Automated regression testing helps catch bugs before the deployment deadline.
- Scale with cloud-based testing infrastructure. As applications become complex, confirm that testing infrastructure can scale to accommodate expanding numbers.
Regression analysis vs. correlation analysis
Regression analysis is a predictive modeling technique used to examine a dataset's relationship between a target variable and independent variables. Various regression analysis techniques are employed based on whether the relationship between the target and independent variables is linear or nonlinear and when the target variable comprises continuous values.
Correlation analysis measures the relationship between two variables instead of assessing how two numeric variables affect one another.
Learn more about the difference between regression and correlation and understand when to use which.

Sagar Joshi
Sagar Joshi is a former content marketing specialist at G2 in India. He is an engineer with a keen interest in data analytics and cybersecurity. He writes about topics related to them. You can find him reading books, learning a new language, or playing pool in his free time.


")


")


