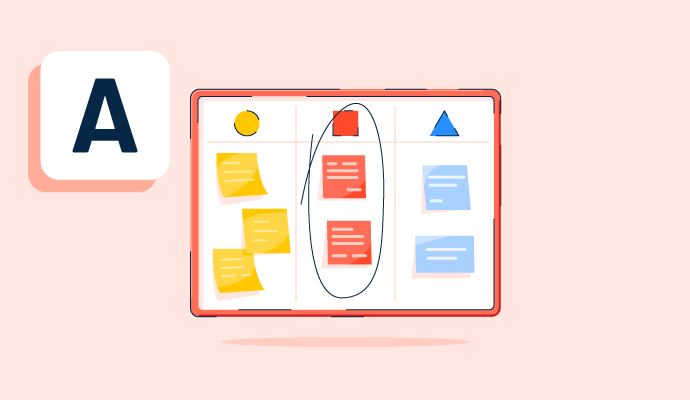
What is an affinity diagram?
Affinity diagrams, sometimes referred to as affinity maps, are visual tools people use to group information from a brainstorming session. Teams use affinity diagrams to arrange large amounts of data into common themes based on their relationships or similarities. Affinity maps help teams process complex ideas, engage in meaningful conversations, improve processes, and create innovative solutions.
Many organizations use visual collaboration platforms to allow remote and co-located teams to collaborate in real time from wherever they are. These platforms provide a scalable canvas for team members to contribute to and organize information simultaneously. Some everyday use cases for these tools include project planning, prototyping, retrospectives, meeting management, and brainstorming.


Where did affinity diagrams come from?
Japanese anthropologist Jiro Kawakita invented affinity mappings in the 1960s, sometimes referred to as the KJ method in Kawakita’s honor. Affinity diagrams are one of the Seven Management and Planning Tools founded in Japanese total quality control (TQC) research. Teams across different industries and projects use affinity diagrams in their work today.
Affinity mapping use cases
There are specific criteria for which teams should use affinity mapping. They should consider using affinity diagrams when:
- Analyzing large datasets. Brainstorming sessions help teams generate new ideas, which can turn into a large number of data solutions to work with. Affinity diagrams allow teams to analyze a large quality of solutions or data following a brainstorming session.
- Sorting information by theme. Affinity mapping is an effective exercise for grouping information into themes and categories. It can encourage teams to develop relationships among ideas and look for patterns in a visual view.
- Working with visual information. Affinity diagrams make it easy for teams to visualize and process information. Visualizing data and ideas can inspire team members to discover connections between solutions that may be siloed otherwise.
Steps for creating an affinity diagram
Affinity diagrams are essential for processing business information. Teams should follow the below steps to create an affinity map.
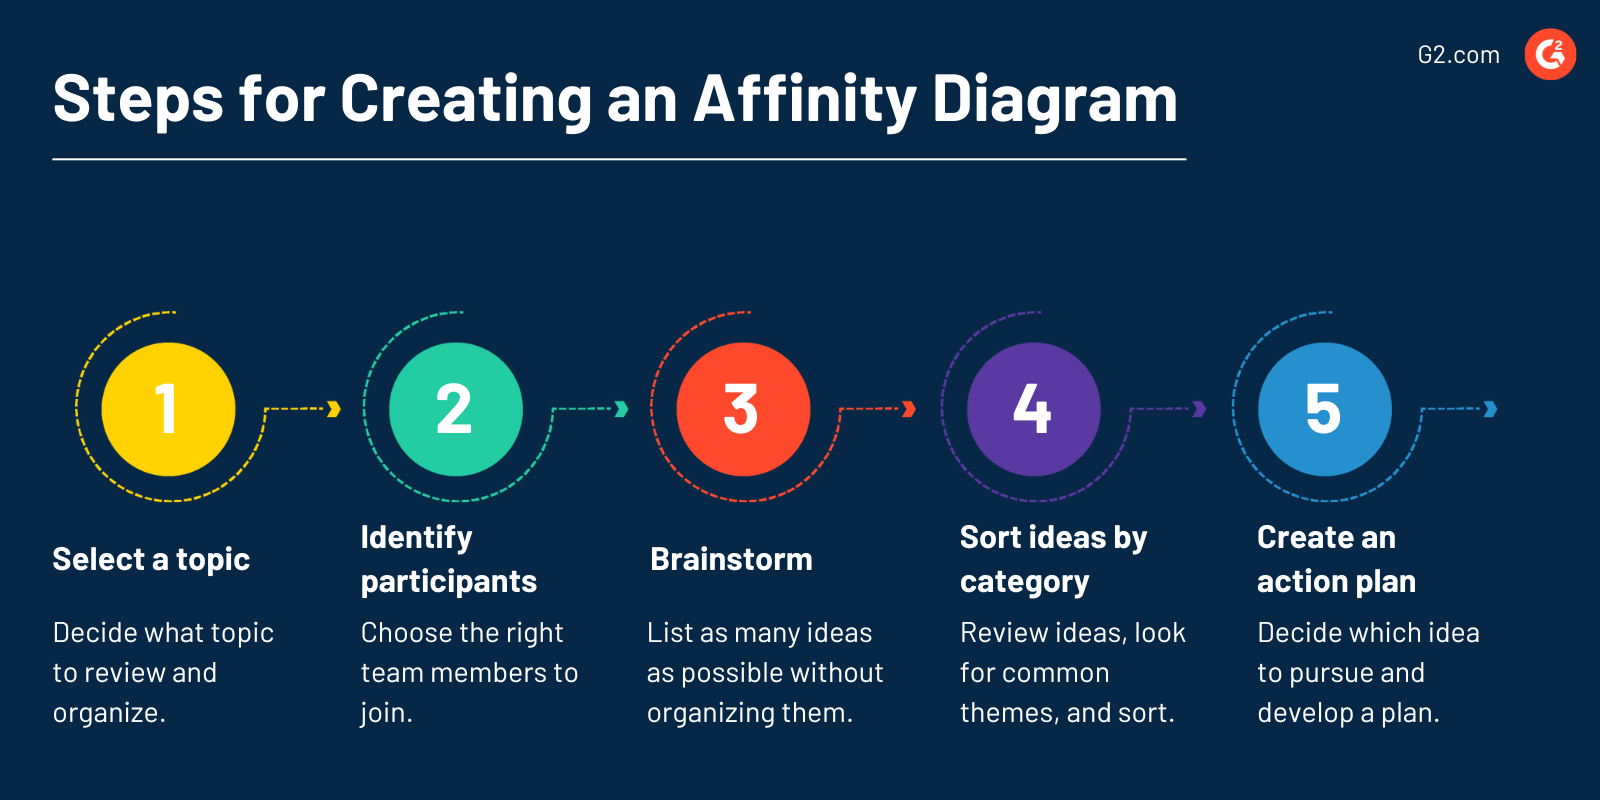
- Select a topic. Teams must first decide and clarify what topic they need to review and organize. Some examples include innovating ideas for a new service offering, identifying process or procedural issues, or analyzing customer research.
- Identify the right participants. Businesses should consider creating cross-functional teams to engage in the affinity diagramming process because each team member brings a unique skill set and perspective. The right participants will have context on the topic and be ready to offer ideas.
- Conduct a brainstorming session. Teams need to run a brainstorming session first and should record individual thoughts on the problem they’re solving or the question they’re answering. The goal is to list as many ideas as possible without categorizing or organizing them because affinity maps are tools to use after a brainstorming session.
- Sort the ideas from the brainstorm by category. With an exhaustive list of ideas, teams should review the information and look for common themes. For the best results, groups can play around with different categorizations to determine which makes the most sense.
- Create an action plan. Once team members place their ideas in categories and determine which grouping offers the best way forward, they should create an action plan. As part of the plan, team members must make a timeline and conduct regular follow-ups to measure progress.
Affinity diagram best practices
Successful affinity diagrams require a willingness to work against the status quo. Although methods vary by topic and business needs, following these best practices increases the likelihood of success.
- Avoid worrying about the amount of data. Too much data might feel overwhelming to stakeholders. Not enough data may induce worries that the team won’t be able to draw conclusions and create an action plan. Instead of focusing on the amount of data, teams should generate thoughtful ideas and create categories using what’s available. New ideas will surface as needed throughout the process.
- Try not to group information prematurely without viewing the whole picture. Identifying connections and creating categories too soon can limit the team’s thinking and narrow the direction without fully exploring the range of possibilities. Suppose team members start sorting information early in the process. In that case, the facilitator should encourage them to revisit the categories they’ve come up with when the time is suitable for the whole group.
- Use the right tools and software. Teams can create an affinity diagram by brainstorming ideas on sticky notes and sorting them into categories in a physical shared space. When that option doesn’t exist, businesses should equip their teams with the right tools that enable them to conduct virtual sessions with drag-and-drop sticky notes, color-coded options, and visual maps that are easily customizable.
Learn more about visual collaboration and how it can bring a project to life.

Alyssa Towns
Alyssa Towns works in communications and change management and is a freelance writer for G2. She mainly writes SaaS, productivity, and career-adjacent content. In her spare time, Alyssa is either enjoying a new restaurant with her husband, playing with her Bengal cats Yeti and Yowie, adventuring outdoors, or reading a book from her TBR list.


