


Wenn Ihr Unternehmen seine Daten nicht genau unter die Lupe nimmt, verpassen Sie eine ganze Welt von Möglichkeiten.
Mit Hilfe von Business Analytics kann Ihre Organisation mehr mit ihren Daten machen als je zuvor, Sie müssen nur wissen, wo Sie anfangen sollen. Ob Vorhersagen treffen oder Trends finden, die Verwendung von statistischer Analysesoftware ist Ihre beste Wahl für die benötigten Einblicke.
Was ist statistische Analyse?
Statistische Analyse ist das Sammeln und Analysieren von Datenproben, um Muster und Trends aufzudecken und vorherzusagen, was als nächstes passieren könnte, um bessere und wissenschaftlichere Entscheidungen zu treffen.
Es gibt viel, was ein Unternehmen mit seinen Big Data machen kann, und statistische Analyse ist eine Möglichkeit für Organisationen, es auf intelligente Weise zu untersuchen und daraus zu lernen. Sie befasst sich mit einer Vielzahl von Datenkomponenten, einschließlich Datenerhebung, Umfragen und Experimenten.
Als ein Aspekt der Business Intelligence untersucht die statistische Analyse Geschäftsdaten und berichtet über Trends anhand von fünf Schritten.
- Beschreiben Sie die Art der Daten, die analysiert werden sollen
- Untersuchen Sie die Beziehung der Daten zur zugrunde liegenden Population
- Erstellen Sie ein statistisches Modell, um das Verständnis darüber zusammenzufassen, wie die Daten mit der zugrunde liegenden Population zusammenhängen
- Beweisen oder widerlegen Sie die Gültigkeit des Modells
- Verwenden Sie prädiktive Analysen, um Szenarien zu erstellen, die zukünftige Aktionen leiten
In der Statistik ist eine Population die gesamte Gruppe von Daten, die analysiert wird. Dies kann sich auf Daten wie eine ganze Gruppe von Menschen, Objekten, Tieren, wie viele Besuche im Jahr im Krankenhaus gemacht werden, Ereignisse oder sogar Messungen beziehen. Sie kann jede Größe haben, solange sie alle analysierten Daten umfasst.
Bedeutung der statistischen Analyse
Sobald die Daten gesammelt sind, kann die statistische Analyse für viele Dinge in Ihrem Unternehmen verwendet werden. Einige davon sind:
- Zusammenfassen und Präsentieren der Daten in einem Diagramm oder einer Grafik, um wichtige Erkenntnisse zu präsentieren
- Entdecken von entscheidenden Messgrößen innerhalb der Daten
- Berechnen, ob die Daten leicht gebündelt oder verteilt sind, was auch Ähnlichkeiten bestimmt
- Zukunftsprognosen basierend auf vergangenem Verhalten erstellen
- Eine Hypothese aus einem Experiment testen
Es gibt mehrere Möglichkeiten, wie Unternehmen die statistische Analyse zu ihrem Vorteil nutzen können. Einige dieser Möglichkeiten umfassen die Identifizierung, wer in Ihrem Verkaufsteam schlecht abschneidet, das Finden von Trends in Kundendaten, das Eingrenzen der besten Produktlinien, das Durchführen von Finanzprüfungen und das bessere Verständnis, wie sich die Verkaufsleistung in verschiedenen Regionen des Landes unterscheiden kann.
Möchten Sie mehr über Statistische Analysesoftware erfahren? Erkunden Sie Statistische Analyse Produkte.
Statistische Analyse vs. Datenanalyse
In der Business Intelligence ist es üblich, statistische Analyse und Datenanalyse zu verwechseln, um verschiedene Probleme zu lösen, die eine Organisation erleben kann. Die Datenanalysetools und der gesamte Prozess haben jedoch wesentliche Unterschiede im Vergleich zu den gängigen Arten der statistischen Analyse.
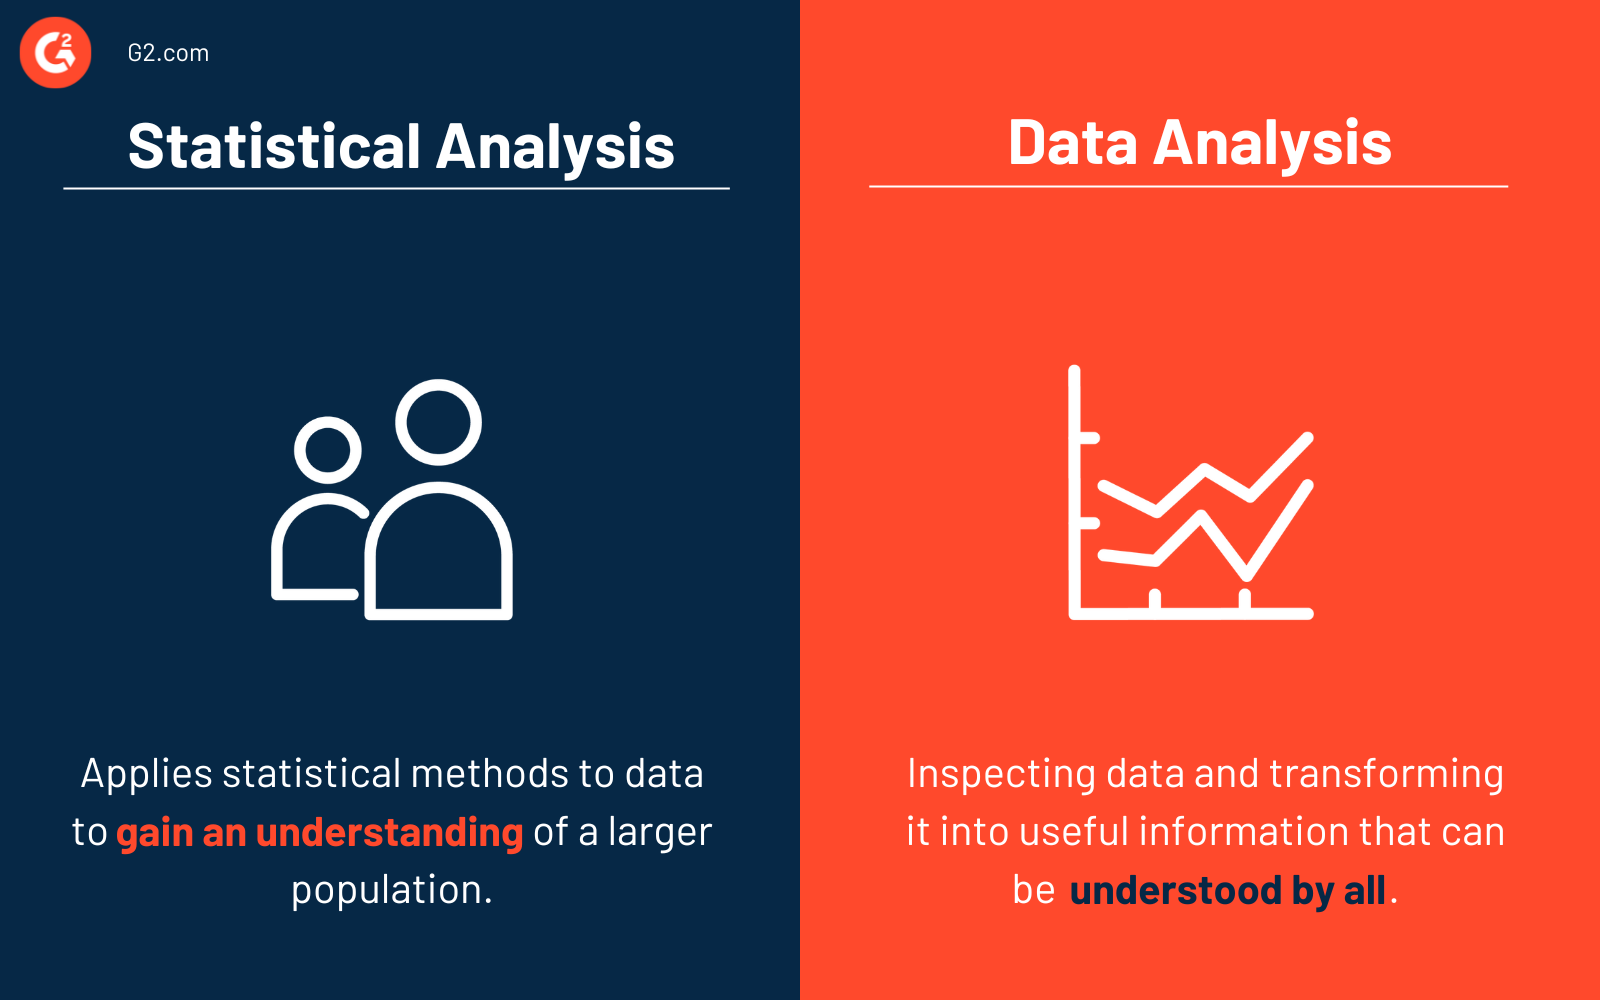
Statistische Analyse wendet spezifische statistische Methoden auf eine Datenprobe an, um die gesamte Population zu verstehen. Sie ermöglicht es, Schlussfolgerungen über bestimmte Märkte, Kohorten und eine allgemeine Gruppierung zu ziehen, um das Verhalten und die Eigenschaften anderer vorherzusagen.
Datenanalyse ist der Prozess der Inspektion und Bereinigung aller verfügbaren Daten und deren Umwandlung in nützliche Informationen, die von nicht-technischen Personen verstanden werden können. Dies ist entscheidend, wenn man bedenkt, dass Daten bedeutungslos sein können, wenn sie nicht von denjenigen verstanden werden, die Entscheidungen treffen.
Datenanalyse kann als Eingabe verwendet werden, um statistische Analysen durchzuführen, da Daten aus verschiedenen Quellen kombiniert werden können, um den statistischen Prozess durchzuführen.
Haupttypen der statistischen Analyse
Wenn Sie statistische Analysen auf Ihr Unternehmen anwenden, sind die beiden Haupttypen, die Sie verwenden werden, deskriptiv und inferentiell. Es gibt jedoch auch andere Typen, die viele Unternehmen je nach dem Gesamtziel oder der Frage, die die Organisation beantworten möchte, verwenden.
Deskriptive statistische Analyse
Deskriptive Analyse erstellt einfache Berichte und Grafiken mit Datenvisualisierungssoftware, die es Unternehmen ermöglicht zu verstehen, was zu einem bestimmten Zeitpunkt passiert ist. Es ist wichtig zu beachten, dass sich die deskriptive Analyse nur auf Ereignisse bezieht, die in der Vergangenheit stattgefunden haben.
Der eigentliche Datenanteil der deskriptiven Analytik konzentriert sich darauf, die Frage „Was ist passiert?“ zu beantworten, indem er tief in vergangene Daten eintaucht.
Wie der Name schon sagt, wird sie verwendet, um die grundlegenden Merkmale vergangener Informationen zu beschreiben und sie einfach und rational zusammenzufassen. Es ist wichtig zu beachten, dass diese Art der statistischen Analyse nicht verwendet wird, um Schlussfolgerungen zu ziehen. Sie können nur beschreiben, was etwas ist und was die Daten aus der Vergangenheit darstellen.
Zum Beispiel kann ein Unternehmen die deskriptive statistische Analyse verwenden, um den Verkehr Ihres Unternehmens im vergangenen Jahr zu betrachten. Sie können Dinge wie sehen, wann der Verkehr zurückging, wann er wieder anstieg, welcher Monat den meisten Verkehr hatte und den durchschnittlichen Verkehr jedes Monats. Diese Daten sagen Ihnen jedoch nicht, warum der Verkehr zurückging.
Die deskriptive statistische Analyse beschreibt nur die Daten oder fasst die Informationen um die Daten herum zusammen. Es ist dennoch wichtig, Ihre Daten auf eine sinnvolle Weise zu verstehen.
Die Ziele der deskriptiven Analyse sind:
- Daten auf eine visuelle Weise beschreiben
- Erklären, was die Daten darstellen
Jetzt ist die Zeit, um SaaS-y Nachrichten und Unterhaltung mit unserem 5-minütigen Newsletter, G2 Tea, zu erhalten, der inspirierende Führungspersönlichkeiten, heiße Takes und kühne Vorhersagen bietet. Abonnieren Sie unten!

Inferentielle statistische Analyse
Während deskriptive Statistik die Einschränkung hat, dass sie nur breitere Annahmen über die Daten, Objekte oder Personen, die Sie messen, zulässt, kann die inferentielle statistische Analyse diese Einschränkung lösen.
Inferentielle Statistik ist das Ergebnis komplizierterer und mathematischer Schätzungen. Die analysierten Proben ermöglichen es den Benutzern, Trends über eine größere Population zu folgern oder zu schließen. Sie nimmt Daten aus einer Stichprobe und zieht dann Schlussfolgerungen über eine größere Population oder Gruppe.
Inferentielle statistische Analyse wird oft verwendet, um die Beziehung zwischen Variablen innerhalb einer Stichprobe zu untersuchen, was Schlussfolgerungen und Verallgemeinerungen ermöglicht, die die Population genau repräsentieren. Und im Gegensatz zur deskriptiven Analyse können Unternehmen eine Hypothese testen und verschiedene Schlussfolgerungen aus diesen Daten ziehen.
Als Beispiel: Sie möchten wissen, was der Lieblingstopping von jedem auf der Welt ist. Wahrscheinlich werden Sie nicht alle Menschen auf der Welt interviewen. Stattdessen würden Sie versuchen, eine repräsentative Population von Menschen zu befragen und Ihre Ergebnisse zu hypothesieren.
Aus einer geschäftlichen und realistischen Perspektive möchten Sie vielleicht jedem Ihrer Kunden eine Frage zu Ihrem Produkt oder Ihrer Dienstleistung stellen. Wenn Sie 100.000 Kunden haben, könnte es schwierig sein, jeden von ihnen zu befragen. Stattdessen würden Sie mit einer Stichprobengruppe von Kunden arbeiten.
Obwohl dieser Prozess nicht perfekt ist und es schwierig sein kann, Fehler zu vermeiden, macht er es Forschern einfach, fundierte Schlussfolgerungen über die Population zu ziehen.
Die Ziele der inferentiellen Statistik sind:
- Schlussfolgerungen aus analysierten Daten ziehen
- Verschiedene Hypothesen rund um die Daten testen
Verwandt: Erfahren Sie mehr darüber, wie Daten-Sampling Ihrem Unternehmen das größere Bild geben kann.
Andere Arten der statistischen Analyse
Abgesehen von diesen beiden Haupttypen gibt es andere Beispiele für statistische Analysen, die Unternehmen kennen sollten.
Prädiktive Analyse
Wenn Sie Vorhersagen über zukünftige Ereignisse treffen möchten, die Ihr Unternehmen erleben könnte, wenden Sie sich an prädiktive Analysen, die detailliert beschreiben, was wahrscheinlich als nächstes passieren wird. Diese Analyse basiert auf aktuellen und historischen Fakten und verwendet statistische Algorithmen und maschinelles Lernen, um die Wahrscheinlichkeit zukünftiger Trends basierend auf historischen Daten zu definieren.
Die Branchen, die am meisten von prädiktiven Analysen profitieren, sind Marketingunternehmen, Versicherungsfirmen und Finanzdienstleister, aber jedes Unternehmen kann einen großen Nutzen daraus ziehen, sich auf eine unvorhersehbare Zukunft vorzubereiten.
Der Zweck der prädiktiven Analytik ist:
- Zukünftige Ereignisse mit Hilfe von Daten antizipieren
- Die Wahrscheinlichkeit verschiedener Verhaltensmuster bestimmen
Tipp: Um prädiktive Analysen einen Schritt weiter zu bringen, erkunden Sie, wie Sie Business Forecasting nutzen können, um besser für die Zukunft zu planen und sich einen Vorteil gegenüber der Konkurrenz zu verschaffen.
Präskriptive Analyse
Präskriptive Analyse kann extrem komplex sein, daher wird sie von Unternehmen bei der Durchführung statistischer Analysen noch nicht weit verbreitet eingesetzt.
Während andere Analysetools verwendet werden können, um Schlussfolgerungen zu ziehen, liefert die präskriptive Analyse Ihnen tatsächliche Antworten. Ein hoher Einsatz von maschinellem Lernen ist für diese Art von Berichten erforderlich, da sie Maßnahmen vorschlagen, die als nächstes ergriffen werden sollen. Sie verwendet auch Techniken wie komplexe Ereignisverarbeitung, Graphenanalyse und Simulation.
Bei der Verwendung von präskriptiven Analysen sind die Ziele:
- Die Frage beantworten: „Was sollte als nächstes getan werden?“
- Die richtige Empfehlung für eine bestimmte Entscheidung eingrenzen
Explorative Datenanalyse
Explorative Datenanalyse, auch bekannt als EDA, konzentriert sich darauf, Muster in den Daten zu identifizieren, um potenzielle unbekannte Beziehungen zu finden.
Der Zweck dieser Methode ist es:
- Neue Verbindungen innerhalb der Daten entdecken
- Fehlende Daten oder Fehler in der Datenerhebung überprüfen
- So viele Einblicke wie möglich in Bezug auf den Datensatz sammeln
- Annahmen und Hypothesen überprüfen
Kausalanalyse
Wenn Ihr Unternehmensziel darin besteht, zu verstehen und zu identifizieren, warum Dinge passieren, sollten Sie den Weg der Kausalanalyse einschlagen.
Unabhängig von der Branche Ihrer Organisation werden Sie wahrscheinlich Misserfolge erleben. Kausalanalyse wird verwendet, um zu bestimmen, warum Misserfolge passieren und die Ursache einzugrenzen.
Ein Beispiel für Kausalanalyse ist im IT-Bereich, wenn Unternehmen Qualitätssicherung für verschiedene Software durchführen. Diese Art der statistischen Analyse würde verwendet, um zu untersuchen, warum bestimmte Software fehlgeschlagen ist, ob es einen Fehler, einen Datenverstoß oder einen DDoS-Angriff gab.
Die Ziele der Kausalanalyse sind:
- Schlüsselproblembereiche innerhalb der Daten identifizieren
- Untersuchen und bestimmen, warum ein Fehler aufgetreten ist
Mechanistische Analyse
Von allen Arten der statistischen Analyse ist die mechanistische Analyse die am wenigsten verbreitete. Im Sinne der Big-Data-Analyse und der biologischen Wissenschaft spielt sie jedoch eine entscheidende Rolle im Prozess.
Diese Methode besteht darin, spezifische Änderungen in Variablen zu verstehen, die andere Änderungen in anderen Variablen verursachen. Sie berücksichtigt keine externen Einflüsse außerhalb der Kontrolle eines Unternehmens, wie Temperatur und Zeit. Diese Methode wird verwendet, um zu zeigen, wie Dinge passieren, anstatt zu sagen, wie Dinge später geschehen werden, daher wird sie nicht verwendet, um Vorhersagen zu treffen.
Ein Beispiel für mechanistische Analyse in Aktion ist, wenn diejenigen in der biologischen Wissenschaft Viren studieren und untersuchen, wie verschiedene Teile des Virus durch Änderungen in der Medizin beeinflusst werden.
Der Zweck der mechanistischen Analyse ist:
- Die genauen Änderungen in Variablen verstehen, die zu Änderungen in anderen Variablen führen werden
- Klarstellen, dass alle Daten das Ergebnis dessen waren, was passiert ist, als ein Subjekt eine bestimmte Aktivität durchlief
Beste statistische Analysesoftware
Wenn es um statistische Analysesoftware geht, gibt es eine Vielzahl von Optionen, aus denen Sie wählen können. Diese Software nutzt spezialisierte Programme, die es ihren Benutzern ermöglichen, komplexe statistische Analysen durchzuführen, die sie nicht von Hand machen können.
Statistische Analysesoftware-Tools werden typischerweise von Datenwissenschaftlern und Mathematikern verwendet, können jedoch branchenspezifische Funktionen bieten. Jedes Tool bietet eine einzigartige Reihe von Funktionen, die Ihr Unternehmen als genau das finden könnte, was es braucht.
Um in die Kategorie der statistischen Analyse aufgenommen zu werden, muss ein Produkt:
- Statistische Analysemöglichkeiten, Gleichungen und Modelle bieten
- Datenimport, -vorbereitung und -modellierung bereitstellen
- Komplexe statistische Analysen durchführen
* Unten sind die Top 5 führenden statistischen Analysesoftware-Lösungen aus dem G2 Summer 2023 Grid® Report. Einige Bewertungen können zur Klarheit bearbeitet worden sein.
1. IBM SPSS Statistics
IBM SPSS Statistics hilft Unternehmen jeder Größe, branchenspezifische Probleme zu lösen, die die Entscheidungsfindung vorantreiben. Es bietet fortschrittliche statistische Verfahren und Visualisierungselemente und bietet den Benutzern eine robuste und benutzerfreundliche Plattform, um Daten und komplexe Probleme zu verstehen.
Was Benutzer am meisten mögen:
„Es gibt drei Elemente, die ich bei SPSS hervorheben möchte. Erstens, seine benutzerfreundliche Oberfläche hat ein praktisches Design, das sehr ähnlich zu anderen bekannteren Programmen ist. Zweitens, die große Vielfalt an Funktionen und statistischen Berechnungen, die durchgeführt werden können, von deskriptiver Statistik bis hin zu multivariaten Techniken, und schließlich die Anpassung der statistischen Analysen, die eine breite Palette von Prozessen ermöglicht.“
- IBM SPSS Statistics Review, Alejandro G.
Was Benutzer nicht mögen:
„Integrationen könnten verbessert werden. Auch Programmieraufgaben könnten effizienter sein. Auf diese Weise wäre es möglich, bestimmte Prozesse zu automatisieren.“
- IBM SPSS Statistics Review, Guillermo R.
2. JMP
JMP ist ein Datenanalysetool für Mac und Windows, das die Kraft der interaktiven Visualisierung mit aufschlussreicher Statistik kombiniert. Es macht es Benutzern einfach, Daten zu importieren und zu verarbeiten, die Drag-and-Drop-Oberfläche zu nutzen, dynamisch verknüpfte Grafiken und vieles mehr. Durch modernste statistische Methoden und Geschwindigkeitsanalysetechniken bietet JMP eine lange Liste von Funktionalitäten und Features.
Was Benutzer am meisten mögen:
„Ich mag die Möglichkeit, einfache statistische Tests durchzuführen. Es kann verwendet werden, um Grafiken aus Daten zu erstellen. Es ist unglaublich einfach zu bedienen. Es bietet umfangreiche Beispiele für jeden Test. Es ist sehr nützlich zum Plotten von Daten. Ich liebe, wie einfach es zu bedienen ist.“
- JMP Review, Rogerio M.
Was Benutzer nicht mögen:
„Obwohl die Benutzeroberfläche großartig ist, wünschte ich mir, es gäbe mehr sofortige und direkte ‚Hilfe‘-Optionen innerhalb des Programms. Vielleicht sogar etwas wie Tutorials, die Sie ausführen könnten (innerhalb des Programms, ohne herunterladen oder im Internet suchen zu müssen), wenn Sie zum ersten Mal einen Test durchführen möchten. Vielleicht ein System in natürlicher Sprache verwenden, um dem Programm zu ermöglichen, Ihnen einen vorgeschlagenen Test basierend auf bestimmten Eingaben zu nennen.
Manchmal ist auch ein Teil der Ausgabe etwas verwirrend, besonders für Studenten, die gerade lernen - große Tabellen und Grafiken als Ausgabe zu erhalten, wenn man nur einen p-Wert möchte, kann entmutigend sein.“
- JMP Review, Christopher V.
3. Minitab Statistical Software
Minitab Statistical Software bietet Visualisierungen, statistische Analysen, prädiktive Analysen und Verbesserungsanalysen, um Unternehmen zu helfen, kluge Entscheidungen basierend auf Daten zu treffen. Vom Erkennen von Trends bis hin zur Lösung von Problemen liefert Minitab umfassende Datenanalysen für alle Arten von Organisationen.
Was Benutzer am meisten mögen:
„Ich benutze Minitab seit Jahren und bin immer beeindruckt, wie leistungsstark es ist. Es bietet eine umfangreiche Palette statistischer Werkzeuge. Es kann verwendet werden, um Daten aus verschiedenen Arten von Variablen zu analysieren, wie kategoriale Variablen und kontinuierliche Variablen.“
- Minitab Statistical Software Review, Mary B.
Was Benutzer nicht mögen:
„Minitab kann seine Funktionen verbessern, indem es zusätzliche Datenverarbeitung sowie analytische Werkzeuge ermöglicht, die uns helfen, komplexe Datenkorrelationen leicht zu lösen.“
- Minitab Statistical Software Review, Anshuman S.
4. Posit
Posit erstellt Open-Source-Software für wissenschaftliche Forschung, technische Kommunikation und Datenwissenschaft. Dieses Tool hilft Einzelpersonen, Teams und Unternehmen bei der Datenwissenschaft, der umsetzbaren Entscheidungsfindung und mehr.
Was Benutzer am meisten mögen:
„Posit ist so benutzerfreundlich und leicht zugänglich. Ihr Produkt RStudio ist auch ausgezeichnet. Wir können alles damit machen, wie Datenvorverarbeitung, Analyse, Modellbildung und Visualisierung.“
- Posit Review, Samrit P.
Was Benutzer nicht mögen:
„Ein Mangel an programmatischer Funktionalität kann es schmerzhaft machen, große dynamische Schleifenfunktionen zu implementieren. Debugging-Tools sind auch im Vergleich zu Mainstream-IDEs etwas eingeschränkt.“
- Posit Review, Brodie G.
5. Base SAS
Base SAS bietet Benutzern Programme für Datenmanipulation, deskriptive Berichterstattung, Informationsspeicherung und -abruf sowie ein zentrales Metadaten-Repository. Benutzer von Base SAS können die Programmier- und Wartungszeit erheblich reduzieren, Daten über Umgebungen hinweg integrieren und die Erstellung und Verteilung von optisch ansprechenden Berichten vereinfachen.
Was Benutzer am meisten mögen:
„Base SAS ist das beste Analysetool, insbesondere im Bereich klinischer Studien und Forschung, die statistische Verfahren erfordern. Es bietet einfach zu verwendende, in-Build-Methoden mit vielen Optionen, weniger Codes und weniger Komplexität.“
- Base SAS Review, Ruchi S.
Was Benutzer nicht mögen:
„Die Kapazität des Systems ist im Wesentlichen den Standardparadigmen untergeordnet. Der technische Support, den sie bieten, ist nicht sehr scharfsinnig und oft knapp (bedingt ist er nicht kostenlos, es gibt keine verschiedenen Zielgruppen, in denen wir mögliche Probleme und Lösungen ansprechen können). Darüber hinaus ist es nicht sehr einfühlsam für den Verbraucher und seine Nutzung ist zu Beginn komplex.“
- Base SAS Review, Madhur K.

Eine Methode im Wahnsinn
Egal, welche Methode der statistischen Analyse Sie wählen, achten Sie darauf, jede potenzielle Schwäche sowie ihre einzigartige Formel zu beachten.
Natürlich gibt es keinen Goldstandard oder richtig oder falsch Methode zu verwenden. Es wird davon abhängen, welche Art von Daten Sie gesammelt haben, sowie die Einblicke, die Sie als Endergebnis haben möchten.
Wenn es um Korrelation und Regression geht, wissen Sie, welche Sie verwenden sollten? Finden Sie es hier heraus.

Mara Calvello
Mara Calvello is a Content and Communications Manager at G2. She received her Bachelor of Arts degree from Elmhurst College (now Elmhurst University). Mara writes content highlighting G2 newsroom events and customer marketing case studies, while also focusing on social media and communications for G2. She previously wrote content to support our G2 Tea newsletter, as well as categories on artificial intelligence, natural language understanding (NLU), AI code generation, synthetic data, and more. In her spare time, she's out exploring with her rescue dog Zeke or enjoying a good book.

