


Datenanalyse ist breit, explorativ und geradezu komplex.
Aber wenn wir einen Schritt zurücktreten und versuchen, die Datenanalyse zu vereinfachen, sehen wir, dass sie sich auf diese beiden Punkte reduziert: qualitative vs. quantitative Daten. Der Hauptunterschied zwischen ihnen ist, dass quantitative Daten messbar sind, während qualitative Daten beschreibend sind. Diese beiden Datentypen sind unterschiedlich, bilden jedoch alle Daten, die Sie jemals analysieren werden.
Bevor Sie Daten mit statistischer Analysesoftware analysieren, ist es wichtig, die wesentlichen Unterschiede zwischen qualitativen und quantitativen Daten zu verstehen.
Was ist der Unterschied zwischen qualitativen und quantitativen Daten?
Quantitative Daten können gezählt, gemessen und mit numerischen Werten ausgedrückt werden. Qualitative Daten sind beschreibend und konzeptionell. Qualitative Daten können basierend auf Merkmalen und Eigenschaften kategorisiert werden.
Der wesentliche Unterschied besteht darin, dass quantitative Daten fest oder universell sind, während qualitative Daten subjektiv sind. Zum Beispiel, wenn ein Ball 30 Pfund oder 13,6 Kilogramm wiegt, ist das eine objektive Tatsache über den Ball. Diese Art von Daten ist präzise und schlüssig. Qualitative Daten sind subjektiv, interpretativ und explorativ. Zum Beispiel können zwei Personen ein Ereignis unterschiedlich interpretieren, basierend auf ihren Lebenserfahrungen.
Also, welches ist welches? Jetzt, da wir die Unterschiede haben, lassen Sie uns in jeden Datentyp mit realen Beispielen eintauchen.
Was sind qualitative Daten?
Qualitative Daten sind nicht-statistisch und typischerweise unstrukturiert oder halbstrukturiert. Diese Daten werden nicht unbedingt mit harten Zahlen gemessen, die Sie zur Erstellung von Grafiken und Diagrammen verwenden. Stattdessen werden sie basierend auf Eigenschaften, Attributen, Labels und anderen Identifikatoren kategorisiert.
Qualitative Daten können verwendet werden, um die Frage „warum“ zu stellen. Sie sind investigativ und stellen offene Fragen, um die Forschung durchzuführen. Die Generierung dieser Daten aus qualitativer Forschung wird für Theorien, Interpretationen, die Entwicklung von Hypothesen und erste Verständnisse verwendet.
Beispiele für qualitative Daten
Um qualitative Daten besser zu verstehen, nehmen wir das Beispiel eines Bücherregals. Die folgenden Merkmale dieses Bücherregals bestimmen die Qualität der Informationen, die uns darüber zur Verfügung stehen:
- Aus Holz gefertigt
- In Italien gebaut
- Tiefbraun
- Goldene Knöpfe
- Glatte Oberfläche
- Aus Eiche gefertigt
Wenn wir über qualitative Daten sprechen, sprechen wir über die Merkmale eines bestimmten Objekts. Qualitative Daten werden durch qualitative Analyse detaillierter Informationen über die Materie abgeleitet.
Bei einem Bücherregal gibt es viele Möglichkeiten, qualitative Informationen von verschiedenen Beobachtern zu erhalten. Wenn jemand keine spezifischen Details über das Bücherregal hat, kann er annehmen, dass es aus Teakholz und nicht aus Eiche besteht und eine raue Oberfläche hat, nicht glatt. Ebenso können wir auch darüber diskutieren, aus welcher Art von Eiche es besteht oder aus welchem Teil Italiens es stammt.
So können qualitative Datenidentifikatoren subjektiv sein, was die qualitative Datenanalyse zu einem komplexen Prozess mit zahlreichen Möglichkeiten und Strukturen macht.
Reale Beispiele für qualitative Daten:
- Produktbewertungen
- Interviewtranskripte
- Texte und Dokumente
- Kundenreferenzen
- Antworten von Fokusgruppen
- Notizen und Beobachtungen
- Audio- und Videoaufnahmen
- Labels und Kategorien von Umfragen und Fragebögen
Möchten Sie mehr über Textanalyse-Software erfahren? Erkunden Sie Textanalyse Produkte.
Was sind quantitative Daten?
Im Gegensatz zu qualitativen Daten sind quantitative Daten statistisch und typischerweise strukturiert – das heißt, sie sind starrer und definierter. Dieser Datentyp wird mit Zahlen und Werten gemessen, was ihn zu einem geeigneteren Kandidaten für die Datenanalyse macht.
Während qualitative Daten offen für Erkundungen sind, sind quantitative Daten viel präziser und geschlossen. Sie können verwendet werden, um „wie viel“ oder „wie viele“ zu fragen, gefolgt von schlüssigen Informationen.
Beispiele für quantitative Daten
Schauen wir uns an, wie ein quantitatives Datenset für das Bücherregal aussieht. Stellen Sie sich vor, das Bücherregal ist 3 Fuß lang, wiegt 100 Pfund und kostet 1500 $ — all dies sind quantitative Daten über das Bücherregal.
Reale Beispiele für quantitative Daten:
- Berechnungen (Jahresumsatz)
- Messungen (Höhe, Breite und Gewicht)
- Zählungen (die Anzahl der Personen, die sich für das Webinar angemeldet haben)
- Projektionen (prognostizierter Umsatzanstieg als Prozentsatz während eines Geschäftsjahres)
- Quantifizierung von qualitativen Daten (Berechnung der Kundenzufriedenheit basierend auf Bewertungen auf einer Skala von 1 bis 5)
Hier ist ein Video, das qualitative und quantitative Daten erklärt.
Quelle: Jotform
Qualitative vs. quantitative Daten: Wichtige Unterschiede
In diesem Abschnitt werden wir die qualitativen und quantitativen Datentypen, Forschungsmethoden und Analysetools durchgehen. Aber zuerst schauen wir uns den Hauptunterschied zwischen qualitativen und quantitativen Daten an.
Qualitative Daten sind nicht-numerische Daten, die Forscher verwenden, um zu interpretieren, wie Individuen ihre soziale Realität wahrnehmen und Bedeutung finden. Quantitative Daten sind numerische Daten, die Analysten verwenden, um Beziehungen zwischen Variablen zu finden und Ergebnisse vorherzusagen. Sie bieten ein schlüssiges statistisches Bild hinter einem Trend.
Der wesentliche Unterschied besteht darin, dass qualitative Daten das „Warum“ hinter einer Korrelation oder einem Phänomen beantworten, während quantitative Daten das „Was“ und „Wie“ eines Verhaltens beantworten.
| Qualitative Daten | Quantitative Daten | |
| Definition | Beschreibende und nicht-numerische Daten, die das „Warum“ hinter einem Phänomen erklären | Zählbare, messbare und zahlenbasierte Daten, die Korrelationen in harte Fakten quantifizieren |
| Ziel | Ein Phänomen zu erkunden | Eine Hypothese zu bestätigen |
| Analytisches Ziel | Beziehungen und Variationen zwischen Variablen zu beschreiben und zu erklären | Variationen zu quantifizieren, Ergebnisse vorherzusagen und Merkmale einer Population zu verallgemeinern |
| Datenerhebungsmethoden | Halbstrukturierte Methoden wie Tiefeninterviews, Fokusgruppen und Teilnehmerbeobachtung | Hochstrukturierte Datenerhebungsmethoden wie Umfragen und Fragebögen |
| Datentypen | Ordinale Daten und nominale Daten | Diskrete Daten und kontinuierliche Daten |
| Datenformat | Textuell | Numerisch |
| Frageformat | Offene Umfrage | Geschlossene Umfrage |
| Analysetools | Manuelle Themen- oder Stimmungsanalyse | Diagramme, Tabellen und Statistikprogramme |
| Am besten geeignet für | Durchführung groß angelegter Studien, die darauf abzielen, Trends oder Merkmale um ein Phänomen zu finden | Formulierung und Überprüfung von Hypothesen um eine Korrelation |
Arten von qualitativen und quantitativen Daten
In diesem Abschnitt erkunden wir verschiedene Arten von qualitativen und quantitativen Daten.
Arten von qualitativen Daten
Es gibt zwei grundlegende qualitative Datentypen: ordinal und nominal.
1. Ordinale Daten
Ordinale Daten beziehen sich auf nicht-numerische, qualitative Daten, die Variablen in Kategorien basierend auf der natürlichen Reihenfolge oder Hierarchie der Daten gruppieren. Zum Beispiel können Kunden zwischen schlecht, zufriedenstellend, gut und herausragend wählen, während sie ein Produkt oder eine Dienstleistung bewerten. Obwohl diese Hierarchie die Daten nicht quantifiziert, erhalten Sie dennoch eine grobe Vorstellung von der Kundenzufriedenheit mit Ihrem Produkt.
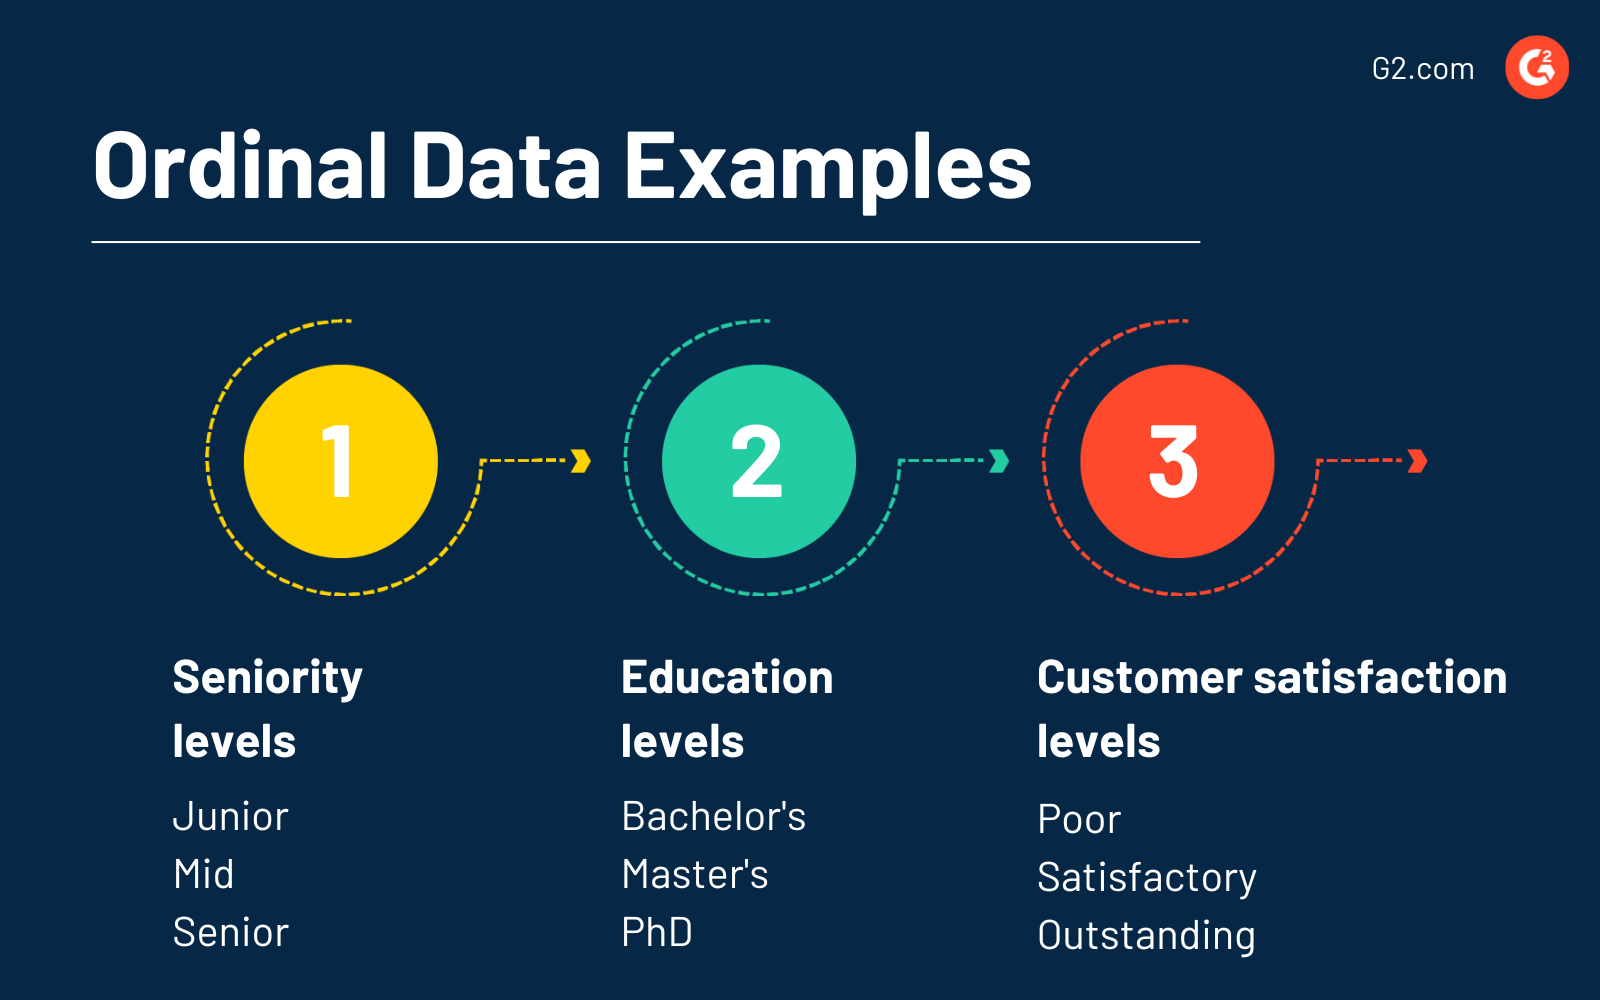
Ordinale Daten können auch numerische Werte enthalten. In solchen Fällen kategorisieren Zahlen Ebenen und haben keinen inhärenten mathematischen Wert. Zum Beispiel können Sie schlecht, zufriedenstellend, gut und herausragend als 1, 2, 3 und 4 kennzeichnen. So schaffen die Zahlen eine Bewertungsskala zur Erfassung unterschiedlicher Kundenzufriedenheitsniveaus.
Merkmale von ordinalen Daten:
- Ordnet Daten in eine Hierarchie oder Reihenfolge ein.
- Ist nicht-numerisch, kann aber mit Daten-Labeling-Software kategorisiert werden.
- Hat trotz der Skala keine gleichmäßige Verteilung.
- Wird mit Häufigkeitsverteilung, Modus, Median und Spannweite der Variablen berechnet.
2. Nominale Daten
Nominale Daten kennzeichnen Variablen in sich gegenseitig ausschließende Kategorien, ohne ihnen quantitative Werte zuzuweisen. Sie können nominale Daten nicht wie ordinale Daten ordnen oder messen.
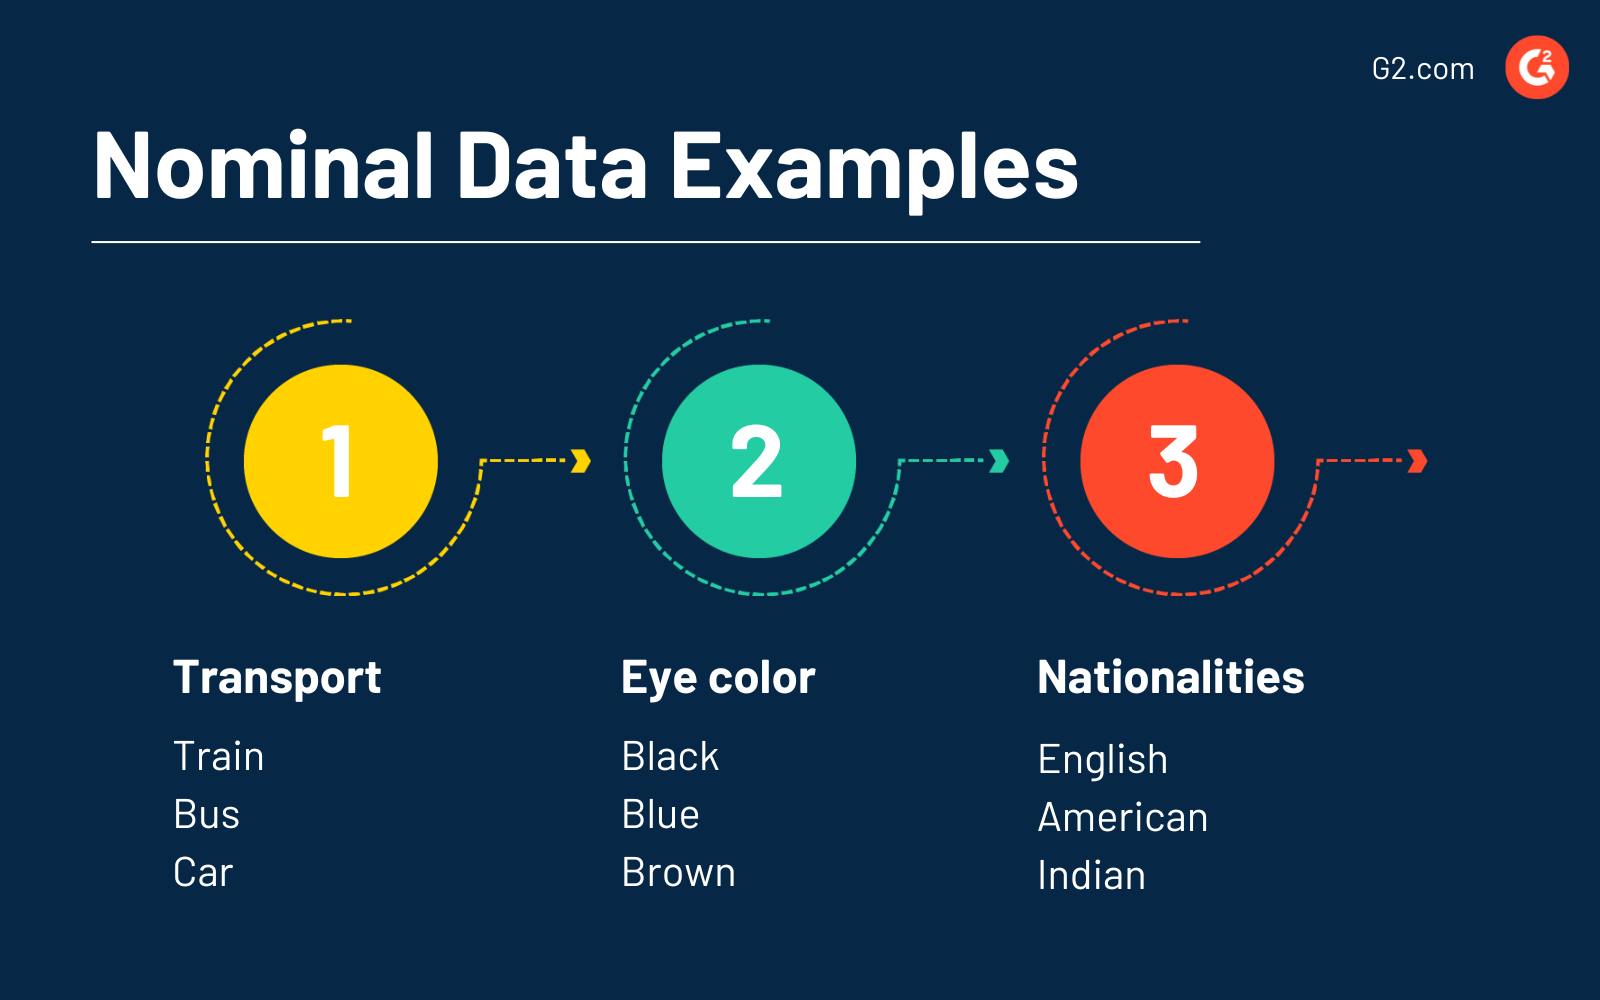
Zum Beispiel können tägliche Pendler in drei Kategorien basierend auf ihrem Transportmittel unterteilt werden, d.h. Bus, Zug und Auto. Aber Sie können mit dieser Art von Daten keine sinnvolle Hierarchieordnung erstellen.
Merkmale von nominalen Daten:
- Ordnet Daten in sich gegenseitig ausschließende Kategorien ein.
- Verwendet beschreibende Labels, die keine quantitativen Werte haben.
- Kann nicht in eine sinnvolle Hierarchieordnung gebracht werden.
- Kann mit Modus, Häufigkeitsverteilung und statistischen Tests berechnet werden.
Arten von quantitativen Daten
1. Diskrete Daten
Diskrete Daten sind Daten, die Sie nicht in kleinere Teile zerlegen können. Dieser Datentyp besteht aus ganzen Zahlen (positive und negative Zahlen, z.B. -100, 10, 100 usw.) und ist endlich (das heißt, er erreicht eine Grenze).
Einige Beispiele für diskrete Daten wären, wie viel Wechselgeld Sie in Ihrer Tasche haben, wie viele iPhones im letzten Jahr verkauft wurden und wie viel Verkehr heute auf Ihre Website kam.
Ein weiterer wichtiger Punkt ist, dass diskrete Daten technisch gesehen kategorisch sein können. Zum Beispiel ist die Anzahl der Baseballspieler in einem Team, die in Mexiko geboren wurden, ganz und diskret.
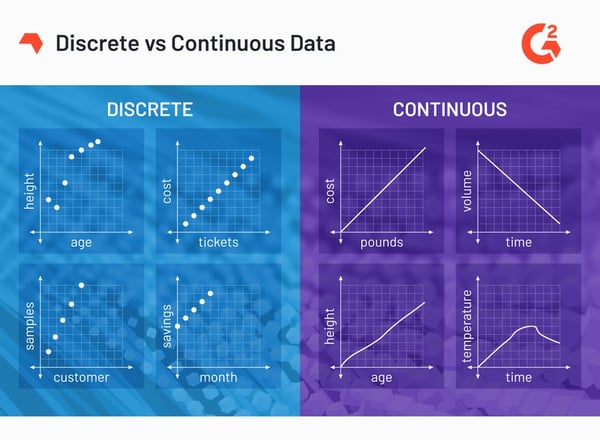
2. Kontinuierliche Daten
Kontinuierliche Daten sind Daten, die unendlich in kleinere Teile zerlegt werden können oder Daten, die kontinuierlich schwanken. Einige Beispiele für kontinuierliche Daten wären die Geschwindigkeit Ihres Zuges während der morgendlichen Fahrt, die Zeit, die Sie benötigen, um einen Artikel zu schreiben, Ihr Gewicht und Ihr Alter.
Qualitative und quantitative Forschung
Ein wesentlicher Unterschied zwischen qualitativen und quantitativen Daten ist, wie sie gesammelt werden. In diesem Abschnitt werden die verschiedenen qualitativen und quantitativen Datenerhebungsmethoden untersucht.
Qualitative Datenerhebungsmethoden
Qualitative Forschung konzentriert sich auf qualitative Datenerhebungsmethoden, um eine Zielgruppe zu studieren und zu beobachten und Schlussfolgerungen aus den gesammelten Daten zu ziehen. Diese Forschungsmethode stützt sich mehr auf subjektive Merkmale, die durch qualitative Ansätze bestimmt werden.
Fokusgruppen
Die Fokusgruppen-Forschungsmethode ist eine der am weitesten verbreiteten qualitativen Forschungsmethoden in der Datenerhebung. Eine Fokusgruppe besteht aus einer bestimmten Anzahl von Befragten (5-10), die als Cluster agieren. Sie können auch Umfragetools verwenden, um einer Fokusgruppe einen Fragebogen zu senden, ihr Feedback oder ihre Meinung zu einem bestimmten Thema zu erhalten und ihre Antworten für eine schnelle Datenanalyse aufzuzeichnen.
Die Bildung und Verwaltung von Fokusgruppen kann ein komplexer und kostspieliger Prozess sein. Es wird von Unternehmen verwendet, die möglicherweise ein neues Produkt auf den Markt bringen möchten, um den Markt zu studieren und Einblicke in die Bedürfnisse, Vorlieben und Verhaltensmerkmale ihrer Zielgruppe zu gewinnen.
Ethnografische Forschung
Ethnografische Forschung beinhaltet die Beobachtung und Untersuchung von Forschungsthemen an einem bestimmten geografischen Standort. Dieser geografische Standort kann von einer kleinen Einheit bis zu Ländern auf der ganzen Welt reichen. Ethnografische Forschung hilft Forschern, Kulturen, Verhaltensweisen, Trends und Schmerzpunkte in einer natürlichen Umgebung zu lernen. Auch diese Forschungsmethode ist zeitaufwändig und herausfordernd und kann über einen bestimmten Zeitraum hinausgehen.
Fallstudie
Eine Fallstudie ist eine eingehende Analyse, die hauptsächlich in den Sozial- und Bildungswissenschaften verwendet wird. Jede Organisation, groß oder klein, kann sie durchführen, um eine detaillierte Schlussfolgerung zu einem Thema zu ziehen. Eine Fallstudie ist auch eine der einfachsten, aber zeitaufwändigen Forschungsmethoden, die die Datenerhebung aus mehreren Quellen umfasst.
Erzählung
Die narrative Forschungsmethode stützt sich auf die Entwicklung oder Erstellung einer Geschichte. Sie fügen eine Reihe von Ereignissen zusammen und erstellen eine Erzählung um ein beobachtetes Thema. Diese Untersuchungsmethode zeigt, wie eine kleine Einheit ein bedeutendes Ereignis beeinflussen und ihre Beziehung bestimmen kann.
Phänomenologie
Phänomenologie ist eine weitere Forschungsmethode, die ein bestimmtes Ereignis oder Phänomen für die qualitative Datenerhebung betrachtet. Sie hilft einem Beobachter zu verstehen, wie, warum und was ein Phänomen auftritt und welche Auswirkungen es auf das Problem hat. Die Phänomenologie verwendet verschiedene Datenerhebungsmethoden, von Dokumenten, Videos und Interviews bis hin zum Besuch eines Ortes, dem Erleben des Phänomens und der Beschreibung, wie es sich im Laufe der Zeit entwickelt und entwickelt hat.
Grounded Theory
Die Grounded Theory konzentriert sich darauf, die Gründe für das Auftreten eines Ereignisses zu erklären. Die Stichprobengröße, die für die Grounded Theory verwendet wird, liegt normalerweise unter hundert Probanden und bewertet, wie etwas zu einem bestimmten Zeitpunkt passiert.
Jetzt ist es an der Zeit, SaaS-y Nachrichten und Unterhaltung mit unserem 5-minütigen Newsletter zu erhalten, G2 Tea, mit inspirierenden Führungspersönlichkeiten, heißen Meinungen und kühnen Vorhersagen. Abonnieren Sie unten!

Quantitative Datenerhebungsmethoden
Quantitative Forschung stützt sich auf numerische und statistische Analysemethoden, die Zahlen und Statistiken verwenden, um vernünftige und eindeutige Schlussfolgerungen zu ziehen. Hier sind einige der gängigen quantitativen Forschungsmethoden.
Korrelationelle Forschung
Eine Korrelation Forschungsmethode untersucht die Beziehung zwischen zwei oder mehr ähnlichen und voneinander abhängigen Variablen. Sie zeigt, wie eine Variable die andere beeinflusst und umgekehrt. Korrelationelle Forschung verwendet mathematische Analysen, um gesammelte Daten zu analysieren. Die Ergebnisse können in einem Diagramm dargestellt oder in Statistiken generiert werden, um die Forschungsergebnisse abzuschließen.
Experimentelle Forschung
Eine experimentelle Forschungsmethode ist ein theoretischer Forschungsansatz. Sie konzentriert sich auf eine Theorie, um zwischen richtigen und falschen Aussagen zu unterscheiden. Diese Forschungsmethode hilft, ein Argument zu überprüfen und wird hauptsächlich in den Naturwissenschaften verwendet.
Kausal-komparative Forschung
Eine kausal-komparative Forschung vergleicht zwei Variablen, die nicht miteinander verwandt sind. Eine ist abhängig, die andere unabhängig. Auch bekannt als quasi-experimentelle Forschung, bestimmt sie die Ursache-Wirkungs-Beziehung zwischen diesen Variablen.
Umfrageforschung
Umfrageforschung ist eine der am weitesten verbreiteten Forschungsmethoden in Bildung, Politik, Wirtschaft und mehr. Organisationen verwenden sie, um Produktfeedback von zufälligen Befragten durch Umfragen, Fragebögen und andere Eingabemethoden zu sammeln. Die gesammelten Daten werden dann analysiert, um quantitative Ergebnisse zu erhalten.
Qualitative vs. quantitative Daten: Analysemethoden
Ein weiterer kritischer Faktor, der qualitative und quantitative Daten unterscheidet, ist, wie Sie sie analysieren. Statistische Analysten gruppieren qualitative Daten in verschiedene Themen, um bedeutungsvolle Kategorien zu finden, während quantitative Daten mathematische Berechnungen verwenden, um Schlussfolgerungen zu ziehen.
Qualitative Datenanalyse
Qualitative Datenanalyse (QDA) organisiert und interpretiert nicht-numerische, konzeptionelle Daten, um Themen zu entdecken und Forschungsfragen zu beantworten. Da es keine Möglichkeit gibt, qualitative Daten objektiv zu messen, ist sie offen für subjektive Interpretation. Im Folgenden sind einige der gängigen Methoden der qualitativen Datenanalyse aufgeführt.
- Inhaltsanalyse verwendet Textanalyse-Software, um quantitative Einblicke aus qualitativen Daten zu gewinnen. Sie tut dies, indem sie die Präsenz bestimmter Konzepte und Themen in Audio-/Videonachrichten, Bildern und Texten quantifiziert.
- Themenanalyse findet gemeinsame Themen und fasst qualitative Datenmuster über Texte hinweg zusammen. Im Gegensatz zur Inhaltsanalyse kann sie nur für qualitative Daten verwendet werden.
- Narrative Analyse interpretiert Testimonials, Interviews, Fallstudien und andere Geschichten von Forschungsteilnehmern, um Einblicke in Verhaltensweisen und Gefühle zu gewinnen.
- Grounded Theory Analyse zielt darauf ab, Theorien zu formulieren, indem Hypothesen mit qualitativen Daten erstellt und getestet werden.
- Diskursanalyse verwendet verschiedene Beobachtungstechniken, um Beziehungen zwischen textuellen oder audiovisuellen Informationen und ihrem Kontext herzustellen.
Nun schauen wir uns die Methoden der quantitativen Datenanalyse an.
Quantitative Datenanalyse
Quantitative Datenanalyse verwendet verschiedene Methoden, abhängig von den vorliegenden Daten. Das ultimative Ziel bleibt jedoch dasselbe – Datenmuster zu finden und Beziehungen zwischen einer Reihe von Variablen zu entdecken. Im Folgenden sind einige der häufig verwendeten Methoden der quantitativen Datenanalyse aufgeführt.
- Regressionsanalyse testet die Beziehung zwischen abhängigen und unabhängigen Variablen.
- Monte-Carlo-Simulation zielt darauf ab, die Wahrscheinlichkeiten eines unsicheren Ereignisses basierend auf vergangenen Daten und einer Handlungswahl vorherzusagen.
- Faktorenanalyse erstellt aus einer großen Anzahl von Variablen weniger Faktoren, um die Variabilität zwischen korrelierten Variablen zu beschreiben.
- Kohortenanalyse ist ein Verhaltensanalytik-Tool. Es analysiert Merkmale einer Kohorte oder einer Gruppe von Individuen mit gemeinsamen Merkmalen, um ihre Handlungen und Nutzungsmuster zu verstehen.
- Clusteranalyse organisiert Elemente in Gruppen von Clustern, um die Assoziation zwischen ihnen zu verstehen.
- Zeitreihenanalyse verwendet Datenvisualisierungstechniken, um die systematischen Musteränderungen zwischen abhängigen und unabhängigen Variablen im Laufe der Zeit darzustellen.
Vor- und Nachteile von quantitativen und qualitativen Daten
Quantitative Daten sind leicht zu sammeln, können jedoch an Kontext fehlen. Zum Beispiel können Sie eine schnelle Umfrage durchführen, um zu verstehen, dass 35 % der Kunden mit Ihrem Produkt oder Ihrer Dienstleistung unzufrieden sind. Aber Sie können wahrscheinlich nicht wissen, was ihre Unzufriedenheit verursacht. Deshalb sind quantitative Daten eine ausgezeichnete Wahl, um verallgemeinerbare Schlussfolgerungen zu ziehen, geben jedoch nicht das vollständige Bild hinter einem Phänomen.
Qualitative Daten hingegen bieten tiefgehende Einblicke und kontextuelle Informationen über ein Phänomen. Zum Beispiel können Sie qualitative Datenanalysetools verwenden, um das Sentiment, die Merkmale und Meinungen der 35 % der Kunden zu verstehen, die mit Ihrem Produkt nicht zufrieden sind. Der einzige Nachteil ist, dass es Zeit braucht, qualitative Daten zu sammeln. Darüber hinaus gibt es größere Chancen auf Voreingenommenheit, da qualitative Daten offen für Interpretation sind.
| Qualitative Daten | Quantitative Daten | |
| Vorteile |
|
|
| Nachteile |
|
|
Was ist besser für die Datenanalyse: qualitativ oder quantitativ?
Jetzt, da wir die Grundlagen von qualitativen und quantitativen Daten aufgeschlüsselt haben, ist es an der Zeit zu überlegen, welcher Typ für die Datenanalyse besser geeignet ist.
Qualitative Daten werden fast immer als unstrukturierte oder halbstrukturierte Daten betrachtet. Diese Art von Daten ist locker formatiert und hat sehr wenig Struktur. Aus diesem Grund können qualitative Daten nicht mit herkömmlichen Methoden gesammelt und analysiert werden.
Das Verständnis von qualitativen Daten kann zeitaufwändig und teuer sein, obwohl es einige Methoden gibt, um diese Daten zu „strukturieren“. Zum Beispiel könnte man Metadaten anwenden, um eine unstrukturierte Datendatei zu beschreiben. Alt-Text ist eine Art von Metadaten, die auf Bilddateien angewendet werden, um Suchmaschinen wie Google, Bing und Yahoo bei der Indizierung relevanter Bilder zu unterstützen.
Der Aufstieg von NoSQL-Datenbanken hat die Sammlung und Speicherung von qualitativen Daten erheblich erleichtert. Es ist jedoch noch ein weiter Weg, bevor diese Daten vollständig genutzt werden können.
Quantitative Daten werden fast immer als strukturierte Daten betrachtet. Diese Art von Daten ist so formatiert, dass sie schnell organisiert und in relationalen Datenbanken durchsuchbar ist. Vielleicht das häufigste Beispiel für strukturierte Daten sind Zahlen und Werte, die in Tabellenkalkulationen zu finden sind.
Da quantitative Daten und strukturierte Daten Hand in Hand gehen, werden quantitative Daten im Allgemeinen für die Datenanalyse bevorzugt.
Wann qualitative vs. quantitative Daten verwenden
- Qualitative Daten zur Analyse von Meinungen, Stimmungen oder Erfahrungen
- Quantitative Daten zum Testen oder Bestätigen einer Hypothese
- Ein gemischter Methodenansatz für komplexe Forschungsanforderungen
Häufig gestellte Fragen zu qualitativen und quantitativen Daten
1. Was ist der Unterschied zwischen qualitativer und quantitativer Forschung?
Qualitative Forschung ist explorativ. Sie sammelt und analysiert nicht-numerische Daten, um die Gründe hinter Meinungen, Erfahrungen, Motivationen und Stimmungen zu verstehen. Quantitative Forschung analysiert numerische Daten, um Beziehungen zwischen Variablen zu finden. Sie ist objektiver und strukturierter als qualitative Forschung.
2. Was sind einige Beispiele für qualitative und quantitative Daten?
Qualitative Daten sind beschreibend und subjektiv. Häufige Beispiele sind:
- Bewertungen
- Interviewtranskripte
- Texte und Dokumente
- Kundenreferenzen
- Antworten von Fokusgruppen
- Beobachtungsnotizen
- Audio- und Videoaufnahmen
Quantitative Daten sind numerisch und objektiv. Häufige Beispiele sind:
- Numerische Umfrageantworten
- Testergebnisse
- Messungen und Zählungen
- Berechnungen
- Projektionen
Wie gut kennen Sie den Unterschied?
Um Ihr Verständnis von qualitativen und quantitativen Daten zu stärken, denken Sie an einige Möglichkeiten in Ihrem Leben, um beides anzuwenden. Beginnen Sie mit sich selbst als Beispiel. Um qualitative Daten zu erfassen, betrachten Sie Identifikatoren wie die Farbe Ihrer Kleidung, die Art Ihrer Haare und die Form Ihrer Nase. Betrachten Sie messbare Werte wie Größe, Gewicht, Alter und Schuhgröße für quantitative Daten.
Mit einem festen Verständnis von qualitativen und quantitativen Daten können Sie beginnen, den Datenanalyseprozess zu verstehen.
Dieser Artikel wurde ursprünglich 2021 veröffentlicht. Er wurde mit neuen Informationen aktualisiert.

Devin Pickell
Devin is a former senior content specialist at G2. Prior to G2, he helped scale early-stage startups out of Chicago's booming tech scene. Outside of work, he enjoys watching his beloved Cubs, playing baseball, and gaming. (he/him/his)

