


Wir alle haben schon einmal gehört, dass „Korrelation keine Kausalität impliziert“, aber was bedeutet das wirklich?
Es läuft alles auf Korrelation vs. Regression hinaus, statistische Analysemethoden, die verwendet werden, um Verbindungen zwischen zwei Variablen zu finden, die Verbindungen zu messen und Vorhersagen zu treffen. Statistische Analysesoftware ermöglicht es Unternehmen, diese komplexen Prozesse durch Datenimport, -vorbereitung und statistisches Modellieren durchzuführen.
Die Untersuchung der Beziehung zwischen zwei Variablen erfordert das Wissen um die Unterschiede und Gemeinsamkeiten zwischen Korrelation und Regression. Es ist üblich, zwischen diesen beiden Begriffen verwirrt zu sein, da Korrelation oft in Regression übergehen kann. Es gibt jedoch einen wesentlichen Unterschied.
Was ist der Unterschied zwischen Korrelation und Regression?
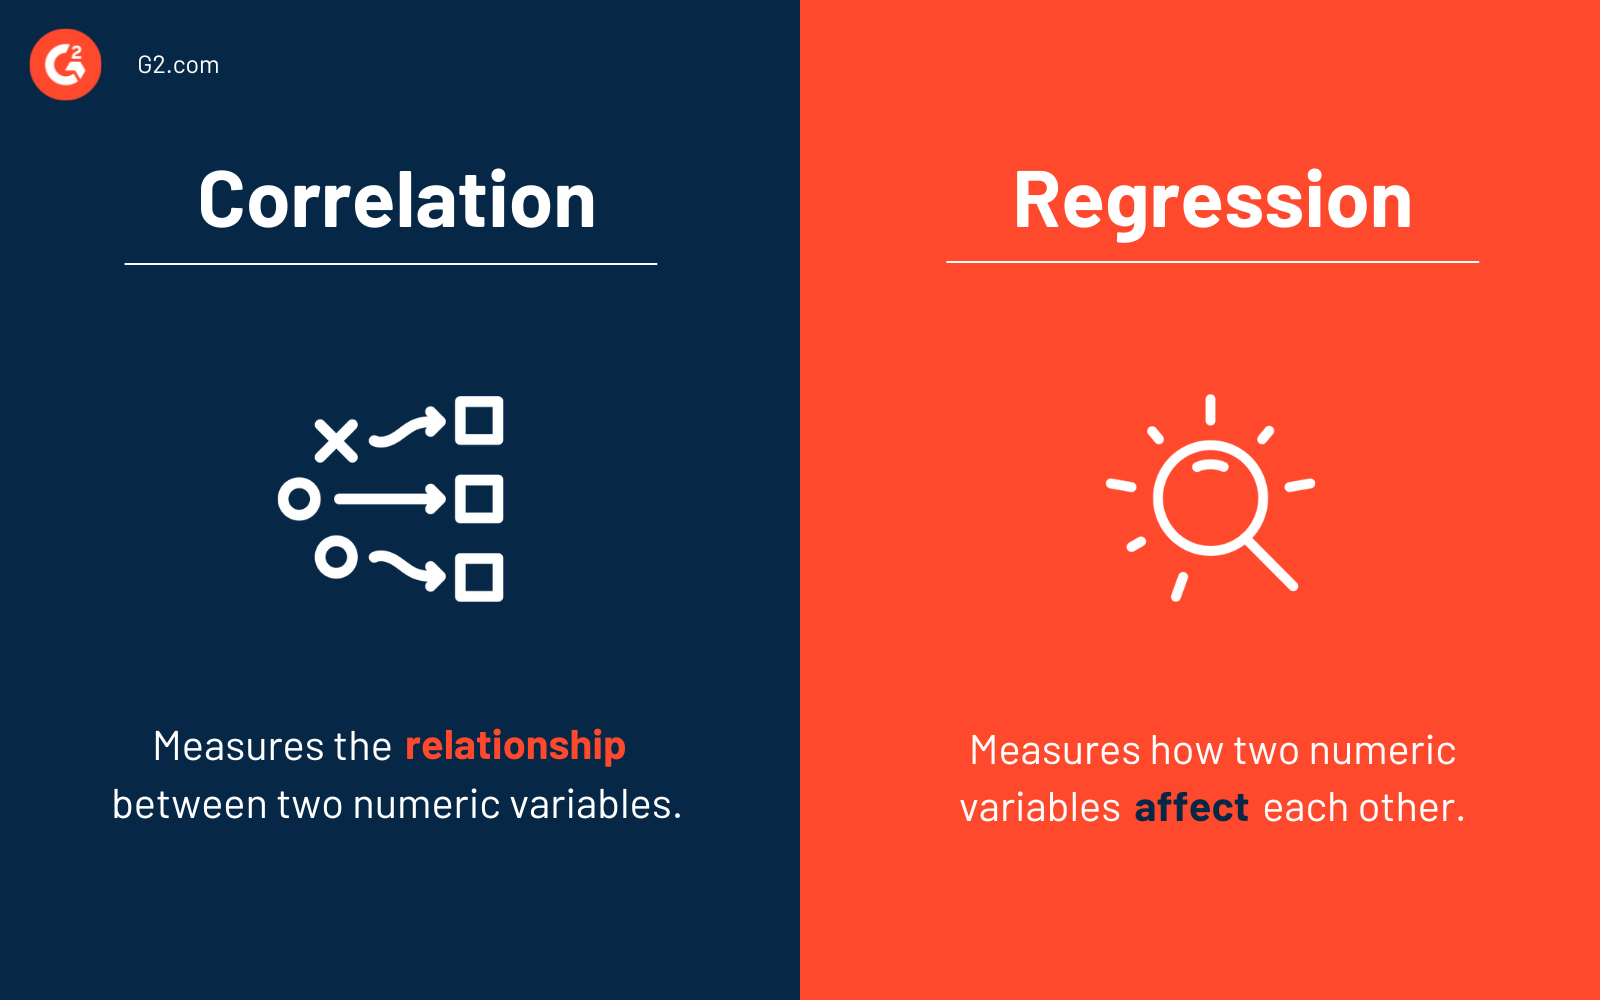
Der wesentliche Unterschied zwischen Korrelation und Regression besteht darin, dass die Korrelation den Grad einer Beziehung zwischen zwei unabhängigen Variablen (x und y) misst. Im Gegensatz dazu beschreibt die Regression, wie eine Variable eine andere beeinflusst.
Im Wesentlichen muss man wissen, wann man Korrelation vs. Regression verwenden sollte. Verwenden Sie Korrelation, um die Stärke und den Grad der Beziehung zwischen zwei oder mehr numerischen Variablen zusammenzufassen. Verwenden Sie Regression, wenn Sie eine numerische Antwort zwischen den Variablen vorhersagen, optimieren oder erklären möchten (wie x y beeinflusst).
Korrelation vs. Regression: Überblick
Die Messung von Korrelation und Regression ist für Unternehmen üblich, aber sie wird auch in unserem täglichen Leben gesehen. Haben Sie zum Beispiel schon einmal jemanden in einem teuren Auto gesehen und automatisch gedacht, dass der Fahrer finanziell erfolgreich sein muss? Oder wie wäre es mit dem Gedanken, dass je weiter Sie bei Ihrem morgendlichen Training laufen, desto mehr Gewicht Sie verlieren werden?
Beides sind Beispiele für Korrelation und Regression im wirklichen Leben, da Sie eine Variable (ein schickes Auto oder ein langes Training) sehen und dann prüfen, ob es eine direkte Beziehung zu einer anderen Variable (reich sein oder Gewicht verlieren) gibt.
| Korrelation | Regression | |
| Wann verwenden | Wenn die direkte Beziehung zwischen zwei Variablen zusammengefasst wird | Um die numerische Antwort vorherzusagen oder zu erklären |
| In der Lage, die Richtung der Beziehung zu quantifizieren? | Ja | Ja |
| In der Lage, die Stärke der Beziehung zu quantifizieren? | Ja | Ja |
| In der Lage, Ursache und Wirkung zu zeigen? | Nein | Ja |
| In der Lage, vorherzusagen und zu optimieren? | Nein | Ja |
| X und Y sind austauschbar? | Ja | Nein |
| Verwendet eine mathematische Gleichung? | Nein | y = a + b (x) |
Unabhängig davon, wofür Sie Korrelation und Regression verwenden, ist die Nutzung einer Business-Intelligence-Plattform der beste Weg, um die Daten, die Sie betrachten, so zu analysieren, dass Sie leicht erkennen können, welche umsetzbaren Erkenntnisse zu ziehen sind. Daten zu analysieren mit Business-Intelligence-Software ermöglicht eine einfache Untersuchung von Big Data, Echtzeitdaten und unstrukturierten Daten und bestimmt Verbesserungsbereiche und andere bemerkenswerte Trends.
Wenn Sie nicht nach Business-Intelligence- oder Analyseplattformen suchen, aber dennoch Korrelation und Regression berechnen möchten, können Sie beides mit verschiedenen Excel-Formeln finden. Denken Sie daran, dass eine BI-Plattform Ihre beste Wahl für erhöhte Effizienz und Genauigkeit ist.
Möchten Sie mehr über Statistische Analysesoftware erfahren? Erkunden Sie Statistische Analyse Produkte.
Was ist Korrelation?
Um Korrelation einfach zu definieren, denken Sie an die Kombination der Wörter „co“ im Sinne von zusammen und „relation“ im Sinne einer Verbindung zwischen zwei Größen.
In diesem Sinne ist Korrelation, wenn eine Änderung einer Variablen in einer anderen folgt, sei es direkt oder indirekt. Variablen gelten als „unkorreliert“, wenn eine Änderung in einer die andere nicht beeinflusst. Kurz gesagt, es misst die Beziehung zwischen zwei Variablen.
Was ist lineare Korrelation?
Abhängig von der Form einer Korrelation kann es sich um eine von drei Arten handeln.
- Lineare Korrelation: Wenn sich zwei Variablen mit einer konstanten Rate ändern, d.h. ihr Beziehungsgraph muss eine gerade Linie sein.
- Nicht-lineare Korrelation: Wenn sich zwei Variablen nicht mit einer konstanten Rate ändern. Der Beziehungsgraph wird eine Kurve sein (Parabeln oder Hyperbeln).
- Monotone Korrelation: Wenn sich zwei Variablen in die gleiche relative Richtung bewegen, aber nicht mit einer konstanten Rate.
Zum Beispiel, nehmen wir an, unsere zwei Variablen sind x und y. Die Art der Korrelation zwischen diesen beiden Variablen kann als positiv oder negativ betrachtet werden. Eine positive Änderung wäre, wenn sich zwei Variablen in die gleiche Richtung bewegen, was bedeutet, dass eine Erhöhung einer Variablen eine Erhöhung einer anderen verursacht. Wenn also eine Erhöhung von x y erhöht, ist es positiv korreliert.
Ein Beispiel dafür wäre Nachfrage und Preis. Eine Erhöhung der Nachfrage verursacht eine Erhöhung des Preises. Der Preis steigt, weil es mehr Verbraucher gibt, die es wollen und bereit sind, mehr dafür zu zahlen.
Angenommen, zwei Variablen bewegen sich in entgegengesetzte Richtungen, wie wenn eine Erhöhung einer Variablen eine Verringerung einer anderen zur Folge hat. Dies wird als negative Korrelation bezeichnet. Ein Beispiel für eine negative Korrelation ist der Preis und die Nachfrage nach zwei Produkten, da eine Erhöhung des Preises (x) eine Verringerung der Nachfrage (y) zur Folge hat.
Zu wissen, wie zwei Variablen korreliert sind, ermöglicht es, Trends in der Zukunft vorherzusagen, da Sie in der Lage sein werden, die Beziehung zwischen den Variablen zu verstehen — oder ob es überhaupt keine Beziehung gibt.
Korrelationskoeffizient
Korrelation zeigt, wie Variablen miteinander verbunden sind. Der Korrelationskoeffizient (von -1 bis 1) quantifiziert diese Beziehung. Ein Wert von 1 zeigt eine perfekte positive Korrelation (beide Variablen bewegen sich in die gleiche Richtung), 0 bedeutet keine Korrelation und -1 zeigt eine perfekte negative Korrelation (Variablen bewegen sich in entgegengesetzte Richtungen).
Korrelationsanalyse
Der Hauptzweck der Korrelation, durch die Linse der Korrelationsanalyse, besteht darin, Experimentatoren zu ermöglichen, die Assoziation oder das Fehlen einer Beziehung zwischen zwei Variablen zu kennen. Wenn diese Variablen korreliert sind, können Sie die Stärke ihrer Assoziation messen.
Insgesamt zielt die Korrelationsanalyse darauf ab, den numerischen Wert zu finden, der die Beziehung zwischen den beiden Variablen zeigt und wie sie zusammen bewegen.
Ein wesentlicher Vorteil der Korrelation ist, dass sie eine prägnantere und klarere Zusammenfassung der Beziehung zwischen den beiden Variablen bietet, als Sie es mit der Regression finden werden.
Korrelationsformel
Die Formel für Pearsons Korrelationskoeffizient (r), das am häufigsten verwendete Korrelationsmaß, lautet:
r = ∑(xi - x̄) (yi - ȳ) / √ [∑(xi - x̄)² * ∑(yi - ȳ)²]
wo,
- xi ist der i-te Wert der x-Variablen
- yi ist der i-te Wert der y-Variablen
- x̄ ist der Mittelwert der x-Variablen
- ȳ ist der Mittelwert der y-Variablen
Korrelationsbeispiele
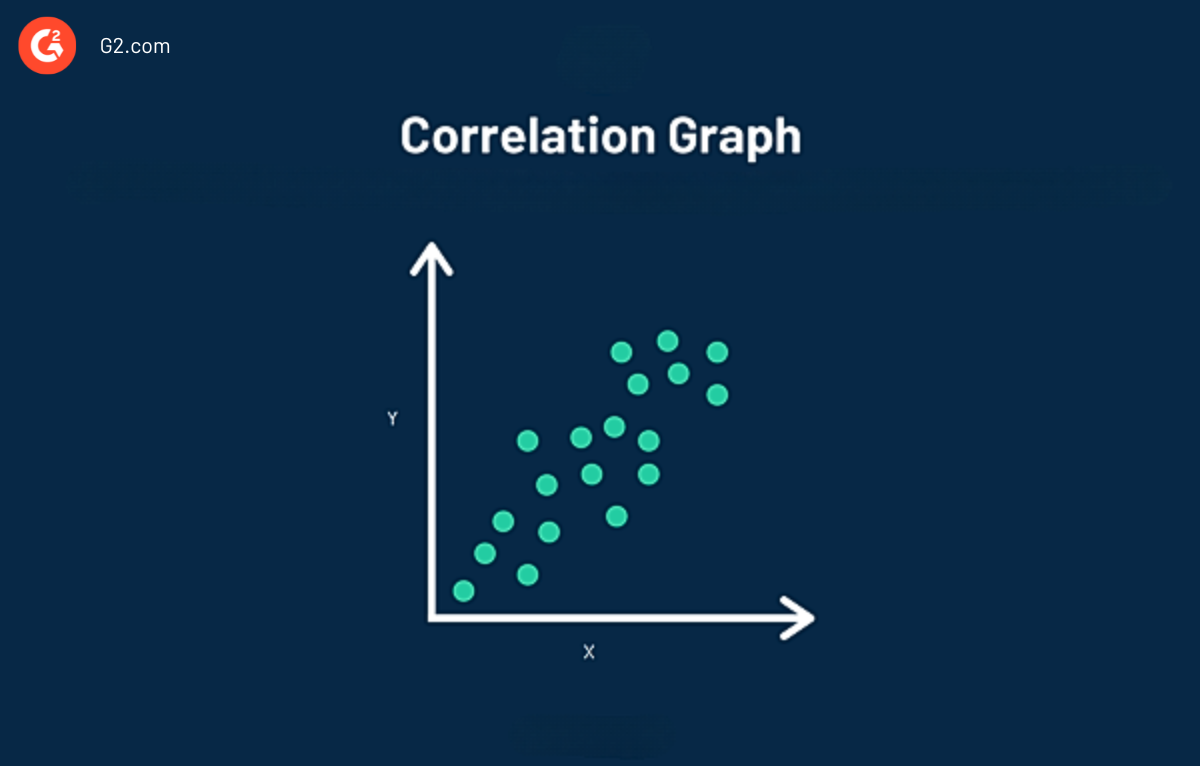
Ein Korrelationsdiagramm, auch bekannt als Streudiagramm, macht es einfacher, die Korrelation zwischen zwei Variablen visuell zu sehen. Daten in einem Korrelationsdiagramm werden durch einen einzelnen Punkt dargestellt. Im obigen Diagramm können Sie beobachten, dass Korrelation verschiedene Punkte einzelner Daten plottet.
Betrachten wir Korrelation als reale Szenarien. Zusätzlich zu dem oben genannten Beispiel von Preis und Nachfrage, aus einer finanziellen Perspektive, je länger Sie investieren, desto mehr Zinseszinsen werden Sie verdienen. Oder, das Einstellen von mehr Verkäufern führt zu höheren Einnahmen, da das Unternehmen mehr Verkäufe macht.
Betrachten wir nun Korrelation aus einer Marketingperspektive, um die Stärke einer Beziehung zwischen den beiden Variablen zu sehen. Zum Beispiel könnte es im besten Interesse Ihres Unternehmens sein, zu sehen, ob es eine vorhersehbare Beziehung zwischen dem Verkauf eines Produkts und Faktoren wie Wetter, Werbung und Einkommen der Verbraucher gibt.
Was ist Regression?
Andererseits ist Regression, wie eine Variable eine andere beeinflusst oder Änderungen in einer Variablen Änderungen in einer anderen auslösen, im Wesentlichen Ursache und Wirkung. Es impliziert, dass das Ergebnis von einer oder mehreren Variablen abhängt.
Zum Beispiel, während Korrelation als die Beziehung zwischen zwei Variablen definiert werden kann, ist Regression, wie sie sich gegenseitig beeinflussen. Ein Beispiel dafür wäre, wie ein Anstieg des Niederschlags verschiedene Pflanzen zum Wachsen bringen würde, genauso wie eine Dürre Pflanzen zum Verwelken oder Nichtwachsen bringen würde.
Wenn die abhängige Variable zunimmt, während die unabhängige Variable abnimmt, oder umgekehrt, wird dies als negative Regression bezeichnet. Dies steht im Gegensatz zu einer positiven Regression, bei der sowohl abhängige als auch unabhängige Variablen zusammen zunehmen.
Regressionskoeffizient
Die Regressionsanalyse modelliert die Beziehung zwischen einer abhängigen Variablen (dem Ergebnis) und einer oder mehreren unabhängigen Variablen (Prädiktoren). Der Regressionskoeffizient, oder Steigung, quantifiziert, wie viel sich die abhängige Variable für jede Einheit ändert, die sich eine unabhängige Variable ändert.
Regressionsanalyse
Regressionsanalyse hilft, die funktionale Beziehung zwischen zwei Variablen (x und y) zu bestimmen, damit Sie die unbekannte Variable schätzen und zukünftige Projektionen zu Ereignissen und Zielen machen können.
Das Hauptziel der Regressionsanalyse besteht darin, die Werte einer Zufallsvariable (z) basierend auf den Werten Ihrer bekannten (oder festen) Variablen (x und y) zu schätzen. Lineare Regressionsanalyse wird als die am besten passende Linie durch die Datenpunkte betrachtet.
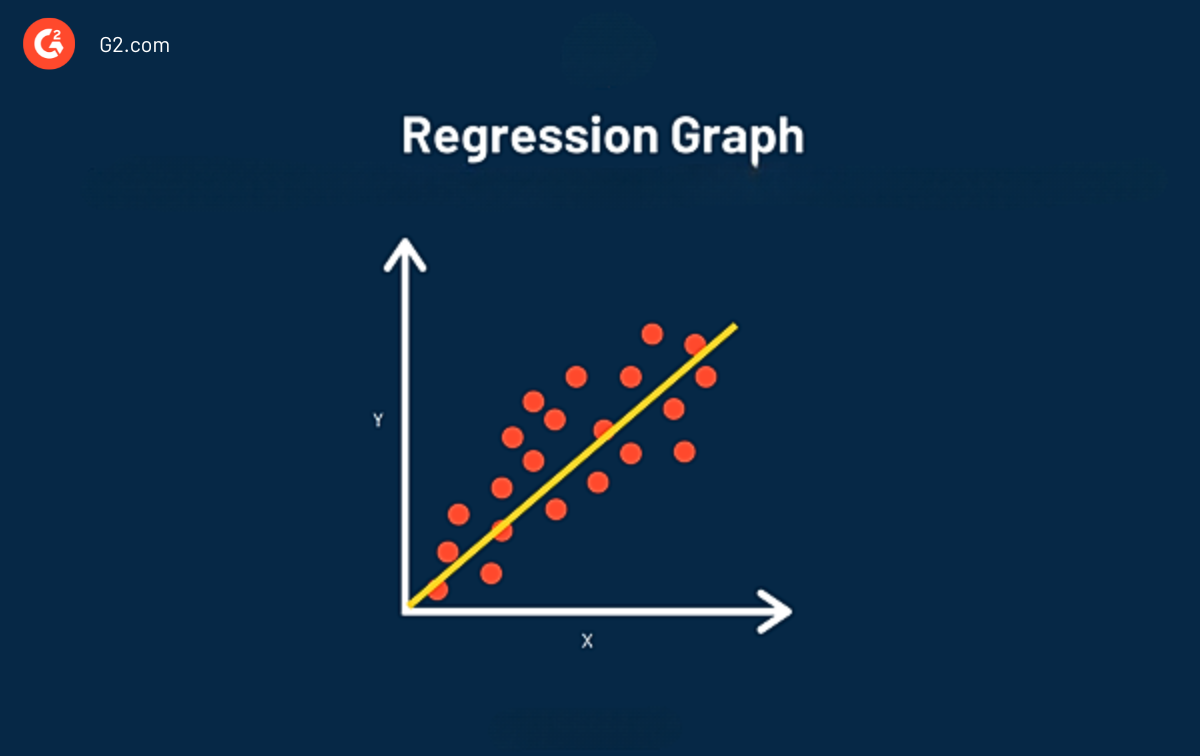
Der Hauptvorteil der Verwendung von Regression in Ihrer Analyse besteht darin, dass sie einen detaillierten Blick auf Ihre Daten bietet (detaillierter als nur Korrelation) und eine Gleichung enthält, die verwendet werden kann, um Ihre Daten in der Zukunft vorherzusagen und zu optimieren.
Wenn die Linie mit Regression gezeichnet wird, können wir zwei Informationen sehen:
Regressionsformel
a → bezieht sich auf den y-Achsenabschnitt, den Wert von y, wenn x = 0
b → bezieht sich auf die Steigung, oder Anstieg über Lauf
Die Vorhersageformel, die verwendet wird, um zu sehen, wie Daten in der Zukunft aussehen könnten, lautet:
y = a + b (x)
Regressionsbeispiele
Wenn es um die Verwendung von Regression geht, nutzen wir bei G2 Regression, um bestimmte Trends vorherzusagen, wie unser Verkehr in den kommenden Monaten voraussichtlich wachsen wird.
Eine Person, die Regression verwendet, ist ein SEO und Datenanalyst. Daten zu visualisieren, zu analysieren, Trends zu identifizieren und vorherzusagen, wie die Daten in der Zukunft aussehen könnten, ist ein großer Teil ihrer Arbeit. Viele Teams verlassen sich auf ihre Arbeit, um Teamziele zu setzen und zu verstehen, wie unser Verkehr in der Zukunft aussehen könnte.
Sie verwenden auch die Vorhersagen aus regressionsbasierten Modellen, um Ziele für wichtige Unternehmenskennzahlen wie Keyword-Akquisition zu setzen. Da die Vorhersagen auf historischen Daten basieren, gibt dies dem Unternehmen Einblicke, wie es derzeit im Vergleich zu vergangenen Wachstumstrends abschneidet.
Unterschied zwischen Korrelation und Regression
Es gibt einige wesentliche Unterschiede zwischen Korrelation und Regression, die wichtig sind, um die beiden zu verstehen.
- Austauschbare Faktoren: Regression stellt fest, wie x y verändert, und die Ergebnisse ändern sich, wenn x und y vertauscht werden. Bei der Korrelation sind x und y Variablen, die ausgetauscht werden können und das gleiche Ergebnis liefern.
- Einzelner Datenpunkt vs. Gleichung: Korrelation ist eine einzelne Statistik oder ein Datenpunkt, während Regression die gesamte Gleichung mit allen Datenpunkten ist, die mit einer Linie dargestellt werden.
- Beziehung vs. Wirkung: Korrelation zeigt die Beziehung zwischen den beiden Variablen, während Regression es uns ermöglicht zu sehen, wie eine die andere beeinflusst.
- Ursache und Wirkung: Die mit Regression gezeigten Daten stellen eine Ursache und Wirkung dar. Wenn sich eine ändert, ändert sich auch die andere, und nicht immer in die gleiche Richtung. Bei der Korrelation bewegen sich die Variablen zusammen.
Jetzt ist die Zeit, um SaaS-y Nachrichten und Unterhaltung mit unserem 5-Minuten-Newsletter, G2 Tea, zu erhalten, der inspirierende Führungskräfte, heiße Takes und kühne Vorhersagen bietet. Abonnieren Sie unten!

Ähnlichkeiten zwischen Korrelation und Regression
Zusätzlich zu den Unterschieden gibt es einige wesentliche Ähnlichkeiten zwischen Korrelation und Regression, die Ihnen helfen können, Ihre Daten besser zu verstehen.
- Beide arbeiten daran, die Richtung und Stärke der Beziehung zwischen zwei numerischen Variablen zu quantifizieren.
- Jedes Mal, wenn die Korrelation negativ ist, wird die Regressionssteigung (Linie im Diagramm) ebenfalls negativ sein.
- Jedes Mal, wenn die Korrelation positiv ist, wird die Regressionssteigung (Linie im Diagramm) positiv sein.
Häufig gestellte Fragen zu Korrelation und Regression
Q. Was sind Regression und Korrelation in der Statistik?
Korrelation und Regression sind Techniken, die verwendet werden, um die Beziehung zwischen zwei quantitativen Variablen zu analysieren. Während die Korrelation die Stärke einer linearen Beziehung zwischen zwei Variablen misst, misst die Regression in der Statistik, wie diese Variablen sich gegenseitig mit einer Gleichung beeinflussen.
Q. Was ist ein wesentlicher Unterschied zwischen Regression und Korrelation?
Korrelation bestimmt die Verbindung oder Beziehung zwischen zwei numerischen Variablen. Regression konzentriert sich darauf, wie sich diese Beziehung im Laufe der Zeit auf jede der Variablen auswirken wird.
Q. Sollte ich Korrelation oder Regression verwenden?
Verwenden Sie Korrelation, um den Grad einer Beziehung zwischen zwei Variablen zu kennen. Aber wenn Sie die Wirkung analysieren möchten, wie eine unabhängige Variable numerisch mit der abhängigen Variable verbunden ist, verwenden Sie Regression.
Q. Können Sie Korrelation und Regression zusammen durchführen?
Ja, Korrelation und Regressionsanalyse können zusammen durchgeführt werden, um einen Datensatz zu messen und das Verständnis der Beziehung zwischen Variablen zu gewinnen.
Es ist mehr als Ursache und Wirkung.
Auch wenn sie zusammen studiert werden, ist es klar, dass es offensichtliche Unterschiede und Ähnlichkeiten zwischen Korrelation und Regression gibt.
Wenn Sie ein Modell, eine Gleichung oder eine Schlüsselantwort vorhersagen möchten, verwenden Sie Regression. Wenn Sie die Richtung und Stärke einer Beziehung schnell zusammenfassen möchten, ist Korrelation Ihre beste Wahl.
Um Ihre Daten weiter zu veranschaulichen, verwenden Sie Datenvisualisierungssoftware und verfolgen Sie Ihre Geschäftskennzahlen und KPIs in Echtzeit.
Dieser Artikel wurde ursprünglich im Jahr 2020 veröffentlicht. Er wurde mit neuen Informationen aktualisiert.

Mara Calvello
Mara Calvello is a Content and Communications Manager at G2. She received her Bachelor of Arts degree from Elmhurst College (now Elmhurst University). Mara writes content highlighting G2 newsroom events and customer marketing case studies, while also focusing on social media and communications for G2. She previously wrote content to support our G2 Tea newsletter, as well as categories on artificial intelligence, natural language understanding (NLU), AI code generation, synthetic data, and more. In her spare time, she's out exploring with her rescue dog Zeke or enjoying a good book.

