
There are many aspects to understanding data analytics, so where does one even get started?
Some may dive right into the programming languages used for analysis, others may look at how analytics are used to solve business problems.
For a simpler starting point, we’ll first explain the types of data being analyzed. Then, we’ll look at the data analysis process, identify sources where data is collected, break down the different types of analytics, and finish with some trends.
But before we can get into any of the above topics, we must first define data analytics.
What is data analytics?
Data analytics is the use of processes and technology, typically some sort of analytics software, to extract valuable insight from datasets. This insight is then applied in a number of ways depending on the business, its industry, and other unique requirements.
This is important because it helps businesses become data-driven, meaning their decisions are supported by data. Data analytics also helps businesses predict problems before they occur and map out possible solutions.
While more businesses turn to data analytics to identify gaps, plenty of people still need clarification. That’s why we’re starting with the root of data analysis: discerning qualitative data from quantitative data.
What is qualitative and quantitative data
Data analytics is comprised of both qualitative and quantitative data. The makeup of these data types is important, considering how it will be analyzed later. Let’s start with qualitative data.
Understanding qualitative data
Qualitative data asks “why” and consists of characteristics, attributes, labels, and other identifiers. Some examples of how qualitative data is generated include:
- Texts and documents
- Audio and video recordings
- Images and symbols
- Interview transcripts and focus groups
- Observations and notes
Qualitative data is descriptive and non-statistical, as opposed to quantitative data.

Understanding quantitative data
Quantitative data asks “how much” or “how many,” and consists of numbers and values. Some examples of how quantitative data is generated include:
- Tests
- Experiments
- Surveys
- Market research
- Metrics
Quantitative data is statistical, conclusive, and measurable, making it a more optimal candidate for data analysis.

With a grasp on the two types of data, it’s now time to see why data structures make such a difference as well.
Want to learn more about Analytics Platforms? Explore Analytics Platforms products.
What is structured and unstructured data
Next, onto structured and unstructured data. How data is structured will determine how it is collected and processed and which methods will need to be used to extract insight. Let’s start with structured data.
Understanding structured data
Structured data is most often categorized as quantitative data. It is, as you may have guessed by its name, highly structured and organized, so it can be easily searched in relational databases. Think of spreadsheets and tables.
Some examples of structured data include:
- Names and dates
- Home and email addresses
- Identification numbers
- Transactional information
Structured data is generally preferred for data analysis since it’s much easier for machines to digest, as opposed to unstructured data.
Understanding unstructured data
Unstructured data actually accounts for more than 80 percent of all data generated today. The downside to this is that unstructured data cannot be collected and processed using conventional tools and methods.
To harness unstructured data, more modern approaches like utilizing NoSQL databases or loading raw data into data lakes will need to be considered.
Some examples of unstructured data include:
- Emails and SMS
- Audio and video files
- Social media
- Satellite and surveillance imagery
- Server and weblogs

Making sense of unstructured data isn’t an easy task, but for more predictive and proactive insights, more businesses are looking at ways to deconstruct it.
The data analysis process
Now that we know the anatomy of data, it’s time to see the steps businesses have to take to analyze it. This is known as the data analysis process.
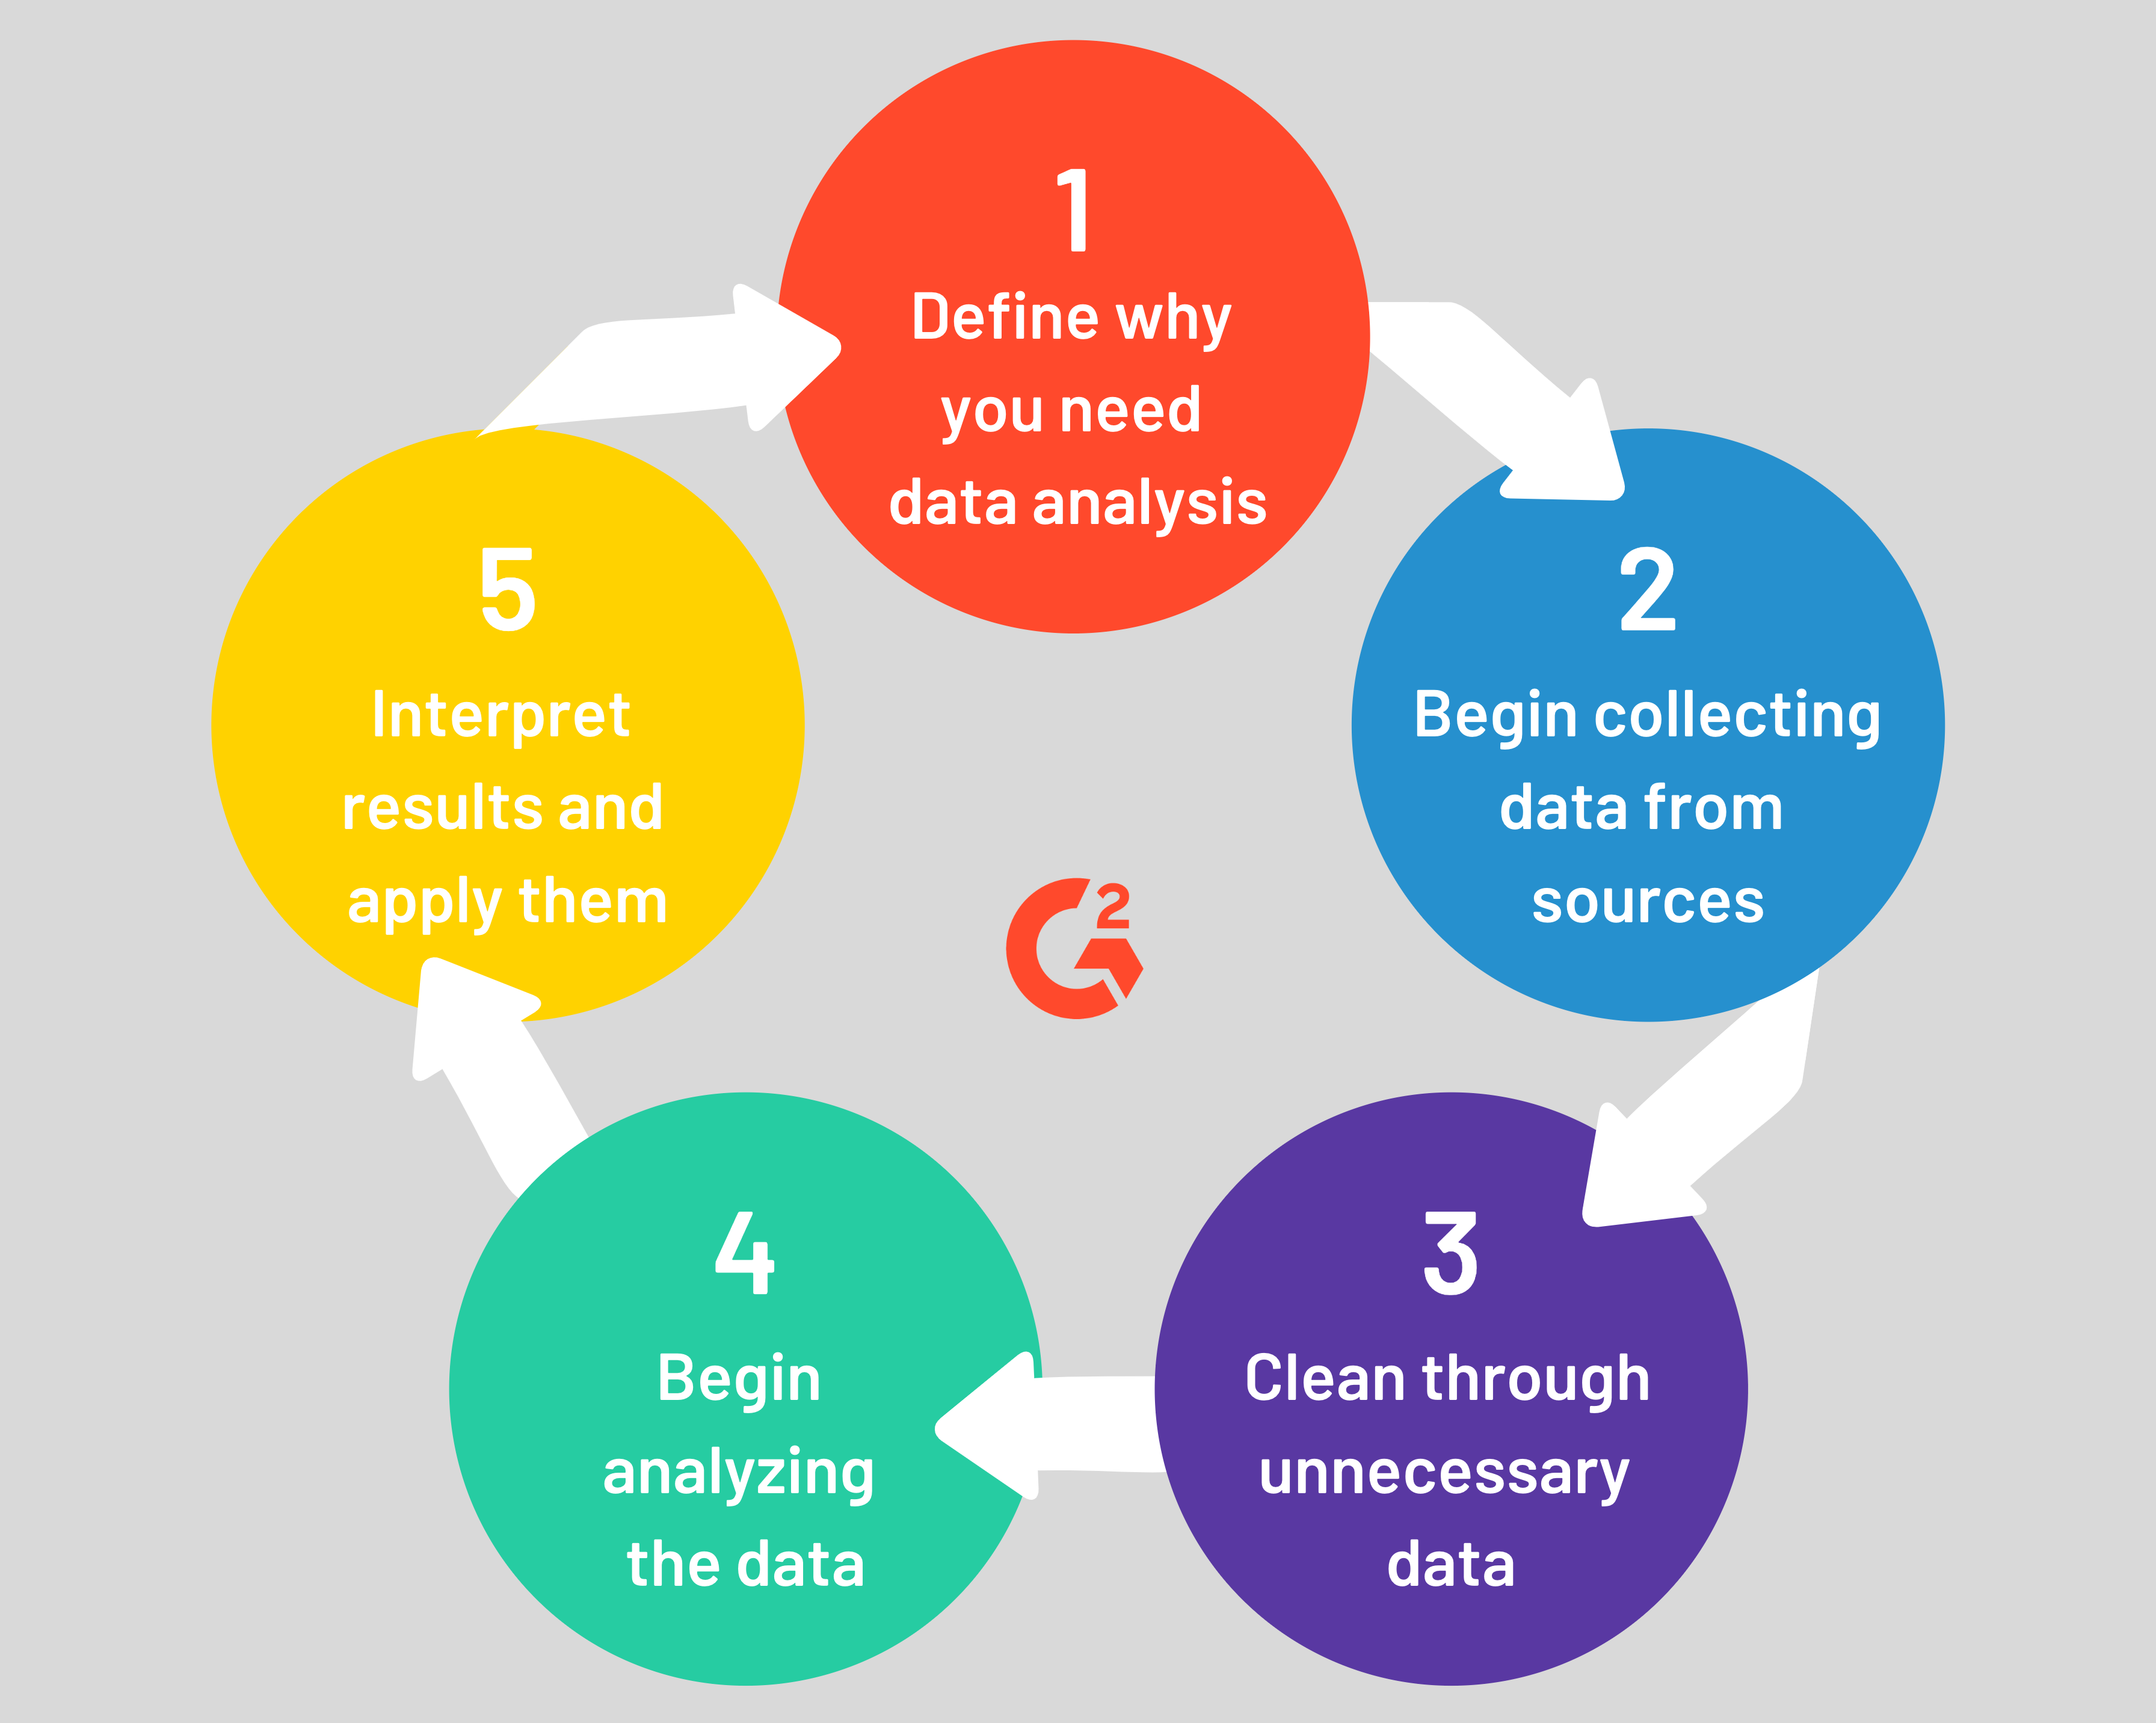
Step 1: Define a need
The first step in this process is defining a need for analysis. Are sales dwindling? Are production costs soaring? Are customers satisfied with your product? These are questions that will need to be considered. Additionally, it's important to have a data management plan set in place. This will ensure that all the data coming in and out of your system is organized and accounted for. Many businesses rely on a data management platform (DMP) to store all data in one centralized hub.
Step 2: Collect data
A business will typically gather structured data from its internal sources, such as CRM software, ERP systems, marketing automation tools, and more. There are also many open data sources to gather external information. For example, accessing finance and economic datasets to locate any patterns or trends.
Step 3: Eliminate duplicates and inconsistencies
After you have all the right data, it’s time to sort through and clean any duplicates, anomalous data, and other inconsistencies that could skew the analysis.
Step 4: Analyze data
Now for the analysis, and there are a number of ways to do so. For example, business intelligence software could generate charts and reports that are easily understood by decision-makers. One could also perform a variety of data mining techniques for deeper analysis. This step depends on the business requirements and resources.
Step 5: Take action
The final step is putting analysis into action. How one interprets the results of the analysis is crucial for resolving the business problem brought up in step one. Your results should paint a clear picture of how to move forward. If not, this is the right time to re-evaluate your data analysis method and see where there could be gaps in your process.
Types of data analytics
Not all analyses are created equal. Each has its level of complexity and depth of insight they reveal. Below are the four types of data analytics you’ll commonly hear about.

1. Descriptive analytics
Descriptive analytics is introductory retrospective and is the first step of identifying “what happened” regarding a business query. For example, this type of analysis may point toward declining website traffic or an uptick in social media engagement. Descriptive analytics is the most common type of business analytics today.
2. Diagnostic analytics
Diagnostic analytics is also retrospective, although it identifies “why” something may have occurred. It is a more in-depth, drilled-down analytical approach and may apply data mining techniques to provide context to a business query.
3. Predictive analytics
Predictive analytics attempts to forecast what is likely to happen next based on historical data. This is a type of advanced analytics utilizing data mining, machine learning, and predictive modeling.
The usefulness of predictive analytics software transcends many industries. Banks are using it for clearer fraud detection, manufacturers are using it for predictive maintenance, and retailers are using it to identify up-sell opportunities.
4. Prescriptive analytics
Prescriptive analytics is an analysis of extreme complexity, often requiring data scientists with prior knowledge of prescriptive models. Utilizing both historical data and external information, prescriptive analytics could provide calculated next steps a business should take to solve its query.
While every business would love to tap prescriptive analytics, the amount of resources needed is just not feasible for many. Although there are some analytics trends, we can expect to take shape soon.
Data analytics trends
As data science becomes more commonplace in business, analytics will surely shift from being retrospective to more proactive and predictive. To validate this, we asked 10 industry experts who work with data for their opinions on top data analytics trends.
Here are some noteworthy highlights:
- One expert says real-time analytics are rising and can potentially transform how professional services operate. Real-time data delivers insight into what is happening now and is optimal for predictive analytics.
- Another expert claimed machine learning will become so prominent that it will leave human users to devise creative treatments to fix problems or maximize profits. Machine learning is incredibly trendy in data analytics today.
- An expert in social media listening technology spoke about the unique bond between data analytics and big data and how companies analyze photos on social media for sentiment.
Best data analytics platforms
Finding the right data analytics platform is essential for businesses looking to make data-driven decisions. Whether you're a SaaS company, a small startup, or a digital marketing firm, the right tool can help you visualize, analyze, and optimize your data for better insights.
To qualify for inclusion in G2's Analytics Platforms category, a product must:
- Provide robust data ingestion, integration, and preparation features as part of the platform
- Consume data from any source through file uploads, database querying, and application connectors
- Allow for the modeling, blending, and discovery of data
- Create reports and visualizations with business utility
- Create and deploy internal analytics applications
Below are the top five leading analytics platfoms from G2’s Winter 2025 Grid® Report. Some reviews may be edited for clarity.
1. Amazon QuickSight: best analytics software for SaaS companies
Amazon QuickSight is a cloud-powered analytics tool with business intelligence (BI) capabilities. It's designed for speed, scalability, and integration with AWS services. For SaaS companies, it offers serverless deployment, auto-scaling, and pay-per-session pricing, making it a cost-effective solution that grows with your data needs.
QuickSight’s cloud-native architecture allows SaaS businesses to scale without worrying about hardware limitations, while its pay-per-session pricing keeps costs manageable.
What users like best:
"What I like most about Amazon QuickSight is how easy it is to use and how quickly it works, regardless of your skill level. Its ease of implementation is impressive, as it’s cloud-based and requires no installations or complex setups. Additionally, the frequency of use is high because it’s so accessible, and the ease of integration with other AWS services makes it a seamless part of your workflow. Overall, it’s a straightforward and efficient tool, and multiple features are very useful for generating reports."
- Amazon QuickSight Review, Ambuj S.
What users dislike:
"At first, yes, I did get the feeling that there is a lack of avenues for dashboard personalization, but the longer that I stayed with the system, the more I realized that the vast majority of our requirements can be satisfied with the provided templates. Though, I still think that a twp or three more types of graphical representation would meet additional needs fairly well."
- Amazon QuickSight Review, Jai C.
2. Microsoft Power BI: best analytics platform for startups and small businesses
Microsoft Power BI is one of the most affordable and user-friendly analytics tools, making it a top choice for startups and small businesses that need robust reporting without enterprise-level complexity. It integrates seamlessly with Microsoft 365, Azure, and third-party business apps, providing a comprehensive, real-time view of business performance.
Power BI’s cost-effective pricing, intuitive interface, and deep integrations with Microsoft tools make it the go-to solution for businesses looking to scale without excessive costs.
What users like best:
"This business analysis tool is a marvel; it can really cover any important task for which a professional person would be needed; it works in several areas, and the performance is excellent. In this case, I highlight the Marketing area because it has helped us to increase the number of customers. Microsoft Power BI offers analytics and monitoring for email or social networks for online marketing campaigns. This has allowed us to evaluate and make successful decisions."
- Microsoft Power BI Review, John A.
What users dislike:
"It does not allow direct export to PHP. It is necessary to use Microsoft's services mandatorily. This somewhat limits the ability to freely upload our Dashboards to a website."
- Microsoft Power BI Review, Lorenzo S.
3. Tableau: best platform to analyze customer data
Tableau is a powerful data visualization tool that allows businesses to explore customer data in a highly interactive, visual-first way. Whether you’re tracking customer behavior, running A/B tests, or analyzing sales trends, Tableau turns complex data into easy-to-understand dashboards.
Tableau’s intuitive visualizations help businesses see trends, patterns, and insights in customer data without requiring advanced analytics expertise.
What users like best:
"It offers an intuitive and highly interactive way to visualize data. The drag-and-drop interface makes it easy to create complex dashboards without requiring extensive technical knowledge. The ability to connect to multiple data sources seamlessly is a significant advantage, and the powerful visualization capabilities allow for clear and insightful data storytelling."
- Tableau Review, Rui R.
What users dislike:
"It has a steep learning curve for beginners. Some advanced functionalities require knowledge of scripting or calculated fields, which can be challenging for non-technical users. Additionally, the pricing structure can be expensive for small businesses, and the desktop version lacks some cloud-based collaboration features found in competitors like Power BI."
- Tableau Review, Miguel R.
4. Alteryx: best analytics software for digital marketing
Alteryx is a data blending and predictive analytics tool that allows marketing teams to process, clean, and analyze data for better campaign performance. Unlike traditional BI tools, Alteryx focuses on automating data preparation and machine learning, making it a must-have for marketers dealing with complex, unstructured data.
Alteryx automates marketing analytics, attribution modeling, and customer segmentation, helping teams improve ROI and data-driven decision-making.
What users like best:
"My company deals with massive amounts of sales and customer data across different regions. We used Alteryx to automate our weekly sales reporting process. Previously, we used Excel to do this process manually. Due to Alteryx’s easy drag-and-drop interface, even non-technical users could build workflows without writing code. Once our team set up the workflow, it could run on schedule without manual intervention."
- Alteryx Review, James A.
What users dislike:
"Alteryx works well for batch processing but does not support streaming data in real time. Also, connecting to social media APIs required custom scripting."
-Alteryx Review, Alexander L.
5. Looker: best analytics software for app developers
Looker is a powerful BI and embedded analytics platform for developing data-driven apps. Unlike traditional analytics tools, Looker uses a modern data modeling approach (LookML) to create custom metrics and reports, making it a favorite for app developers and tech teams.
Looker’s real-time data access and embedded analytics make it a top choice for developers who want to deliver insights directly within their applications.
What users like best:
"Looker has been transformative for how we manage and interpret data. It has become a tool we use weekly, if not daily. It has been central to our data consolidation and centralization process. We've combined sources, including Google Analytics, Search Console, social, and custom spreadsheets, that have completely changed how we approach reporting. It has helped us reduce time to generate reports, draw insights, and reduce errors. It was also easy to implement and scale. Looker has helped us build a culture of data-driven decision-making year-round, giving every team the tools and insights they need to operate effectively and efficiently. I have never had to reach out to customer support, which tells me the tool is doing what it is supposed to do."
- Looker Review, Andrea G.
What users dislike:
"Looker can have a steep learning curve, especially with its LookML modeling language, which may be challenging for non-technical users. Its data visualization options are less customizable than tools like Tableau or Power BI. The reliance on LookML can create bottlenecks for self-service reporting. Looker's pricing can also be expensive, especially for smaller teams. Performance may slow with large datasets, and it lacks some out-of-the-box integrations and collaborative features in other BI tools."
- Looker Review, Shubham S.
FAQs about data analytics software
Still in doubt? Find your answers below.
What’s the difference between business intelligence tools and data analytics platforms?
BI tools focus on historical data reporting, dashboards, and basic trend analysis, while data analytics platforms go beyond BI by offering predictive analytics, AI-driven insights, machine learning models, and real-time data exploration.
What are the leading data analytics platforms for the service industry?
Microsoft Power BI is widely used in service-based businesses for tracking operational performance, financial metrics, and customer satisfaction. Qlik Sense provides AI-driven insights, real-time analytics, and self-service BI capabilities, making it a strong option for service optimization.
Which analytics software is recommended for tech firms and software companies?
Looker is ideal for tech companies needing SQL-based modeling and embedded analytics for software applications. Sisense offers scalable BI tools with AI-powered dashboards, making it great for data-driven decision-making within software firms.
Do I need coding skills to use data analytics platforms?
No. Many platforms, such as Tableau, Power BI, and Zoho Analytics, offer drag-and-drop interfaces that require zero coding knowledge. However, advanced tools like Looker and Sisense may require SQL or Python knowledge for custom data modeling.
Which analytics tools offer the best insights for business intelligence and decision-making?
Power BI is a powerful BI tool with AI-driven recommendations, automation, and enterprise-wide dashboards. Tableau allows businesses to build interactive reports, uncover trends, and visualize data from multiple sources, making it great for strategic decision-making.
What’s the top analytics software for app developers looking to track performance?
With event-based analytics, Mixpanel helps app developers track engagement, retention, and user behavior. Firebase Analytics is built for mobile developers and offers real-time app monitoring, crash reporting, and audience segmentation.
Can small businesses benefit from data analytics?
Small businesses can benefit from affordable and user-friendly platforms like Microsoft Power BI, Zoho Analytics, and Google Analytics to track customer behavior, improve marketing strategies, and optimize business performance.
Which analytics platforms are best for growth tracking and marketing strategy optimization?
Amplitude is a top choice for growth teams needing predictive user insights, behavioral cohorts, and retention analysis. Looker enables marketing teams to build custom analytics pipelines and integrate data from multiple marketing sources.
What are the best data analytics solutions for optimizing business performance?
Tableau is widely used for KPI tracking, financial analysis, and performance optimization dashboards. Sisense provides AI-powered performance insights, predictive analytics, and embedded BI solutions for companies looking to improve operations.
Thinking with data
So, what can you take away from this overview of data analytics?
We know that data can be descriptive and sentimental or conclusive and numerical. How data is structured also plays a key role in its analysis.
When it comes to analysis, there is a general five-step process of defining the need, collecting data, cleaning it, analyzing it, and then interpreting it. Depending on the business requirements, interpretation can vary immensely.
Then, there are four types of data analytics. Some are retrospective, and others are predictive and proactive. The latter will become more commonplace with advances in artificial intelligence, machine learning, statistical modeling, and other data science disciplines.
Ready to conquer big data? Explore how businesses harness data for innovation.
This article was originally published in 2019. It has been updated with new information.
Devin Pickell
Devin is a former senior content specialist at G2. Prior to G2, he helped scale early-stage startups out of Chicago's booming tech scene. Outside of work, he enjoys watching his beloved Cubs, playing baseball, and gaming. (he/him/his)

