

The more data we collect about our marketing activities, the more doors can open to lead us to further success.
Publishing articles, sending messages, and posting on social media are all activities that businesses can track and measure in one way or another to help them determine how close they are to hitting their goals.
The lists of metrics accompanying each marketing activity aren’t short ones. For example, email marketers can focus on metrics like list churn, but they could also focus on the number of characters being used in a subject line in relation to their open rate. Event marketers could focus on metrics like total number of registrants, and they could also focus on reporting their actual event attendance.
Social media managers also have access to an unfathomable amount of data. An increase in posts means an increase in data available to be tracked; unless you get a handle on which of these metrics are crucial, the larger your spreadsheets will grow.
10 social media metrics that are essential to track
- Brand awareness
- Reach
- Audience growth rate
- Share of voice
- Average engagement rate
- Virality rate
- Amplification rate
- Click-through rate
- Conversion rate
- Bounce rate
Like any marketing activity, social media (and its managers) falls prey to the concept of vanity metrics: which of the many metrics available are going to be the most meaningful when reporting back to your manager?
Weeding out the most important metrics and finding your focus is crucial for any social media manager to prove that their strategy isn’t only working, but also what needs to be done to improve that strategy for the future.
How to measure social media success
In order to avoid being buried in spreadsheets and reporting back to your manager with a monstrous amount of information that can’t be connected with a red thread, follow this advice: know what is relevant.
Measuring your social media marketing activities isn’t about how beautiful your graphics are or how few typos you make – it’s about how your activities contribute to the larger goals of the marketing team, and therefore the business as a whole.
If you had to limit yourself to reporting back five metrics to your manager for them to analyze, which ones would they be?
Setting limits and restrictions as an exercise can turn into a comprehensible, concise section of your marketing dashboard, which is all your manager could possibly dream of. Connect your social media metrics to your KPIs, and you’ll be set.
Below, we’ve highlighted some of the most common social media marketing metrics by the stages of the traditional buyer journey. Measuring these metrics can help you prove that the social strategy you’ve come up with is working for the best.
Awareness metrics
The first stage of the customer journey, awareness, is when potential customers are beginning to realize that they’re experiencing a problem.
Whether they’ve had a bad experience with one brand and are looking to switch, or are realizing a problem for the first time and looking for a solution, these people often begin to take the time to research both the problem and the solution online.
While seeking answers, how many of these people are coming across your brand on social media?
Brand awareness
Brand awareness is the attention your brand receives over a reporting period. To a social media marketer, attention could mean:
- Mentions
- Shares
- Likes
- Impressions
- Comments
It could also mean a combination of some of the above, or a combination of different elements entirely. If you’re measuring this metric, it’s important that you keep the definition of “attention” consistent throughout the reporting process from day one.
For example, noting that your posts in your second quarter received a total of 1,500 likes and 600 comments in contrast to the 1,000 likes and 300 comments in your first quarter could be used as evidence that your brand awareness has grown on your social media platforms.
Again, consistency amongst the metrics you choose to represent "brand awareness" is crucial. Choosing to measure comments in one reporting period and impressions in another makes it extremely difficult, if not impossible for management to draw conclusions.
Post reach
This metric is what tells you how many people have seen your post since you clicked “Publish,” further clarifying your brand’s presence on whichever platforms your audience is active on.
While seemingly small, factors like the time of day you post and the day of the week you post can drastically raise or lower this number.
Post Reach Percentage = (Post Reach + Total Followers) x 100
Note that analytics features within platforms like Facebook and Instagram will actually be able to estimate the days and times of day that your audience are most active. Pay attention to this data and take note of the days and times that you’re choosing to post. Are they in line with the information that your platforms are handing to you on a silver platter?
It may seem trivial, but the more you expand your audience, the better you’re doing your job as a social media marketer. Understanding this metric and taking advantage of the data at your fingertips can help you master this in no time.
Audience growth rate
This metric gathers the speed at which your brand’s following increases on your various platforms. The followers of any account will ebb and flow, which is why it may be helpful to not only track this metric for your own accounts, but also with a competitor’s, too.
This way, you can answer both, “How quickly did we gain last period’s net new followers” and “Did we do it faster than our competitor”.
Growth Rate Percentage = (Net New Followers in Period + Total Audience on Platform) x 100
Taking a look at your audience growth rate can help you better understand the performance of each of your individual platforms and apply the techniques you’re using on your most successful platforms to the ones that may be struggling a little more.
In addition, paying attention to this number during a campaign or product launch can help indicate the success of those activities.
Share of voice
Share of voice measures how many people are mentioning your brand on social media.
Like audience growth rate, share of voice is best measured when compared to your competitors. And, like brand awareness, it’s important to define what a “mention” means and keep that definition consistent: is a mention only considered when people “@” you, or will you take indirect mentions into consideration, too?
There’s no right or wrong answer, it’s just important to make sure your answer doesn’t change over reporting periods.
When measured, share of voice is essentially going to help you understand how big your fish is in the pond of your competitors.
Share of Voice Percentage = ([Brand Mentions + Competitor Mentions] ÷ Total Mentions) x 100
Note that you don’t have to manually search and tally each and every mention you receive—social media monitoring software can save you a lot of time with this one.
Engagement metrics
Seeing your content is one thing, but when your audience begins to take action because of the ideas, graphics, and other assets that you’re sharing every day, that's when you know you’re doing something right.
To prove it, here are some common social media engagement metrics to check out:
Average engagement rate
Typically, engagement in social media is defined as likes, comments, and shares on a post. Your average engagement rate is the number of those actions divided by the number of followers you have on that particular platform.
Tracking comments, likes, and shares alone isn’t enough for social media marketers to present to their managers. Instead, finding the average of all of these is what’s going to be most helpful for whoever receives your report to get a birds’ eye view of what’s happening on a day-to-day basis between your brand and your audience.
This metric is an exciting one to track and improve upon because the more it increases, the more you know content is tapping into your audience and encouraging them to interact with you. In one way or another, this helps them move closer to potentially becoming a customer than if they hadn’t seen or interacted with your post at all.
Total Engagement Rate = (Total Engagement Actions ÷ Total Followers) x 100
Virality rate
Continuing to go beneath the surface of likes and comments on social posts, the virality rate takes the number of people who share your post and the number of unique impressions received during a certain period of time.
Virality Rate = (Number of Shares ÷ Number of Impressions) x 100
This ratio will show what percentage of people who see your post are resonating with the content enough to share it with their own network in contrast to those who may like, comment, or not interact at all.
Amplification rate
Similar to virality rate, this metric also focuses on post shares. However, instead of measuring shares against impressions, amplification rate measures shares against your account’s followers.
Essentially, the amplification rate is the percentage of your followers that are willing (and even excited) to share your content on their own accounts with their own followers.
Amplification Rate = (Total Post Shares ÷ Total Followers) x 100
While virality rate measures against impressions, which can include both followers and non-followers, amplification rate hones in on those who have already taken action with your brand by choosing to follow you. How many of those people are then willing to share your message with their networks?
Conversion metrics
While likes and shares can tell you how well your audience is resonating with your content, high conversion rate means that the effort a social media manager is putting in is more than worthwhile. This set of metrics reveals how many customers are simply interested in your social media content versus which are wanting to interact with your business.
Click-through rate
If your social media post has a call to action, you should always be measuring the click-through rate. While engagement metrics measure the interaction that someone has with your post on the platform, the click-through rate (CTR) measures the willingness of your audience to venture to another page based off of your post.
CTR = (Total Clicks ÷ Total Impressions) x 100
Conversion rate
This metric calculates the number of visitors who not only click through your social media post to the page you’ve led them to, but also take action on that page against the total visitors on that page. Action could mean submitting a form for a demo, registering for a webinar, or subscribing to a newsletter.
A high conversion rate means that the content you’re posting on behalf of your brand is interesting, clear, and relevant.
Conversion Rate = (Conversions ÷ Total Clicks) x 100
To effectively measure this metric, create a post on social media that contains a call to action with a trackable link. Add cookies to a user’s machine to attach anyone who takes action on your post to your social campaign. Then, use a marketing automation software to track the totals of both conversions and total clicks and plug the results into the above equation.
Bounce rate
In contrast to conversion rate, which is the percentage of people who click from your social media post to a page and then take the desired action, bounce rate calculates the percentage of people who click through from social media to the linked page, but then exit upon landing instead of taking action.
A high bounce rate could mean a number of things: your social post is inaccurately portraying what you’re leading your audience to, you’re sharing your content with the wrong audience, and so on. On the other hand, if your social media bounce rate is lower than bounce rates from other traffic sources, that could be just what you need to prove that your efforts are not only driving traffic, but driving high-value traffic to your website.
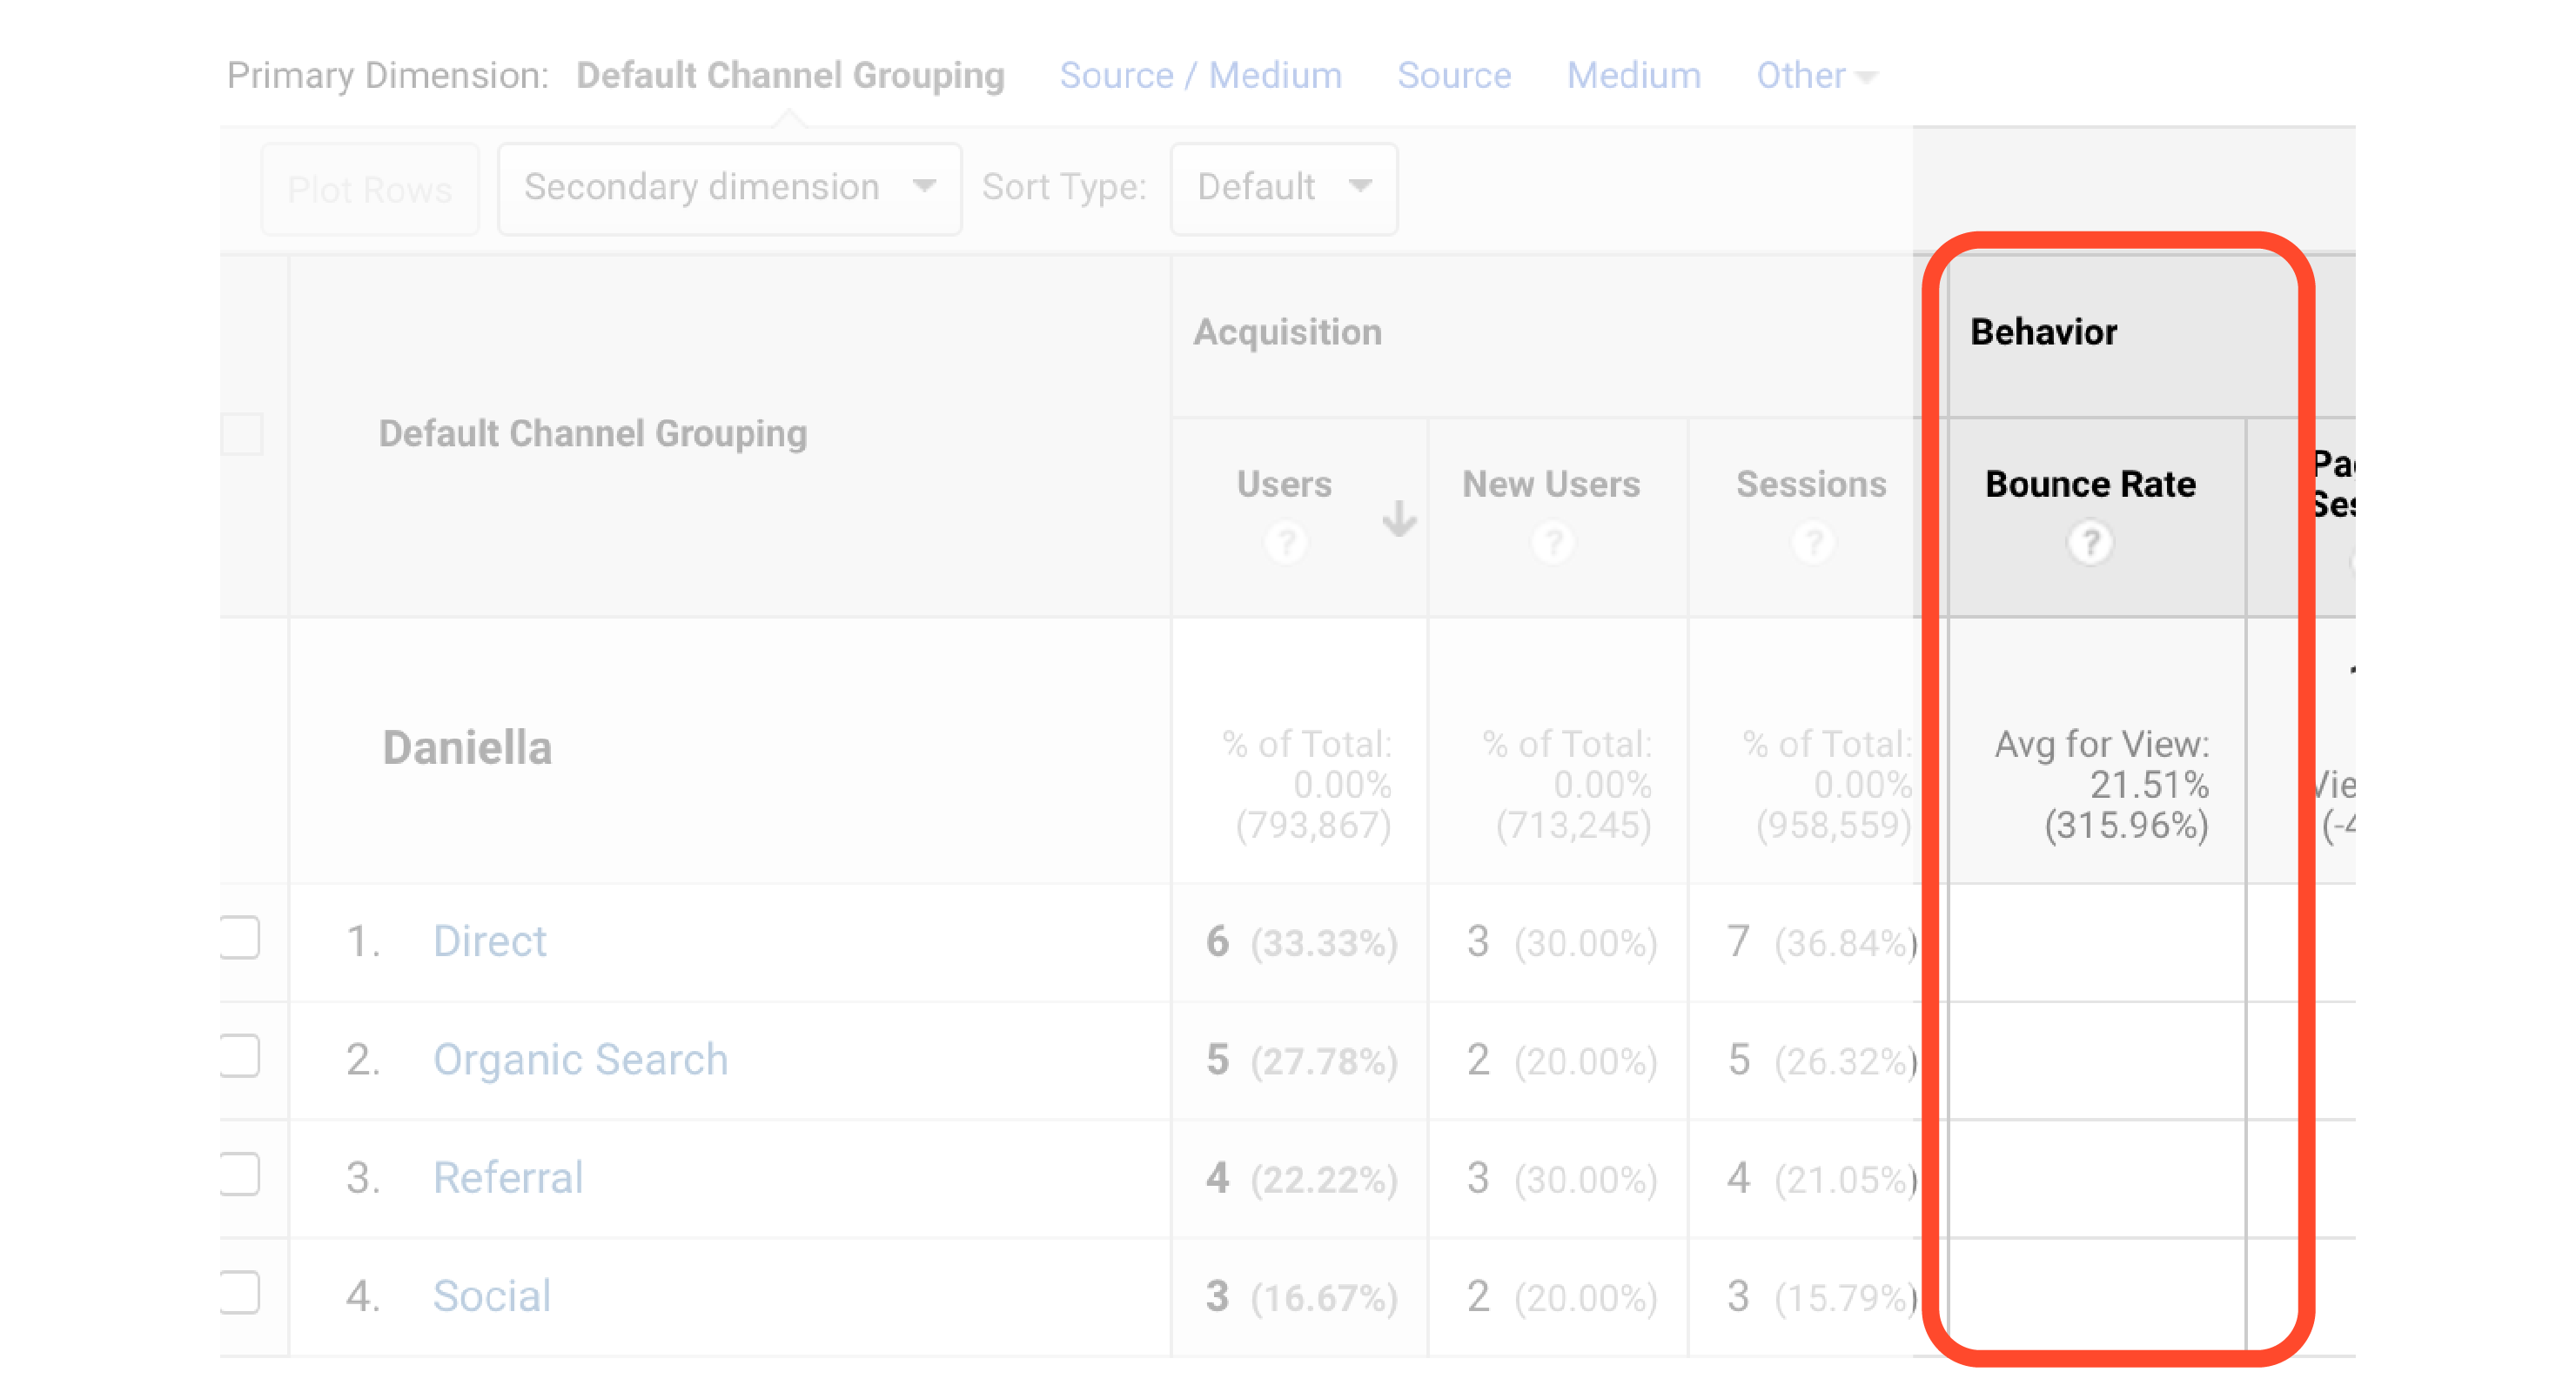
One way to measure bounce rate is with Google Analytics. In the software, find the Acquisition tab, select “All Traffic”, and then “Channels”. Within this screen will be a column titled “Bounce Rate”, in which you’ll be able to see the bounce rate for all traffic sources, including social.
Dive deep
Social media marketing metrics are plentiful, and it can be difficult to choose just a few. Keeping your business goals in mind and weeding out which metrics hold more weight than others can help you begin to funnel down which metrics you’ll be reporting. In addition, try not to be blinded by shiny vanity metrics that, while large in number, are few in impact.
Celebrating success is fun, but making sure that the success you’re celebrating is truly meaningful is important. When measuring, stay in your own shoes and make sure that you’re tracking social media metrics that would be considered both the means to the end and the end. But, when it comes to reporting or consolidating into a dashboard, the ends are the bottom line that your manager is waiting to hear about.
Social media monitoring software can help you keep your eyes on the backend of your platforms, but if you’re looking for a way to automate the front end, social media management software can help you schedule posts, respond to inquiries, and more.
Want to learn more about Social Media Analytics Software? Explore Social Media Analytics products.
Daniella Alscher
Daniella Alscher is a Brand Designer for G2. When she's not reading or writing, she's spending time with her dog, watching a true crime documentary on Netflix, or trying to learn something completely new. (she/her/hers)

