

Data can be complicated.
There is structured and unstructured data, qualitative (or categorical) data, and quantitative (or numerical) data. Quantitative variables can be either discrete or continuous. This article explores the difference between discrete and continuous data.
Discrete variables take on countable and distinct values, whereas continuous variables can take on any value within a data set. Understanding the discrete vs. continuous data concept will help you identify opportunities for each. You can leverage this information for better data insights, whether you're a data scientist, data analyst, data engineer, or just a fan of numbers.
Organizations use statistical analysis software to uncover insights from discrete and continuous data types and simplify complex data analysis.
What is the difference between continuous and discrete data?
Discrete data consists of numerical variables that are whole, concrete numbers with fixed values determined by counting, such as the number of people in a team. Continuous data consists of complex numbers and varying data values measured over a specific time interval, such as the time it takes to run a marathon.
A simple way to understand the difference between the two is to visualize a discrete graph vs. continuous graph. Take a look at this scatter plot versus a line graph.
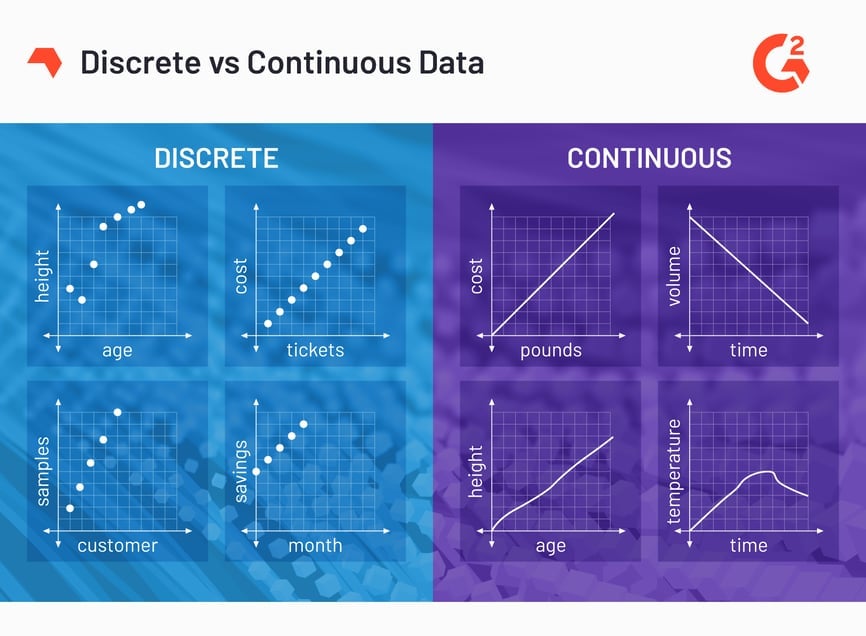
When you collect a set of round, defined numbers, they'll appear on the graph similar to those on the left. Discrete data refers to individual and countable items (discrete variables).
When measuring a certain data stream with a complex result range, the findings are shown with a line as a data range (see: graphs on the right). Continuous data refers to change over time, involving concepts that are not simply countable but require detailed measurements (continuous variables).
Some synonyms for the word discrete are disconnected, separate, and distinct. These synonyms could easily be used to learn more about discrete data.
Let's dive deep into each data type to understand discrete and continuous data better.
What is discrete data?
Discrete data refers to countable, individualized, and nondivisible figures in statistics. These data points exist only in set increments. Data analysts and statisticians visualize discrete data using bar graphs, histograms, line charts, and pie charts.
Discrete data represents discrete variables, which you can count in a finite amount of time. The key feature here is that these variables are countable instead of measurable.
For example, if you track the number of push-ups you do each day for a month, the number of push-ups is a whole number that you can't break down into smaller parts. With that said, your daily tally is discrete data.
Discrete data examples
Discrete data can be qualitative or quantitative. Some quantitative examples of discrete data are:
- Number of product reviews: Discrete because reviews are countable and must be whole numbers without fractions.
- Number of tickets sold in a day: Discrete as you can only sell whole tickets, with no in-between values.
- Number of students in your class: Discrete since students can only be counted as complete units, not fractions.
- Number of employees in a company: Discrete because employees are countable as whole individuals.
Discrete data can also be qualitative. The nationality you select on a form is a piece of discrete data. When grouped, the nationalities of everyone in your workplace can be valuable information in evaluating your hiring practices.
Another example of discrete qualitative data is the data you collect using sliding scales. Imagine collecting product review data from users. You can create ordinal data points, such as easy to use, neutral, and not easy. Visualizing this data helps you quantify qualitative data.
The national census consists of discrete data, both qualitative and quantitative. Counting and collecting this identifying information deepens our understanding of the population. It helps us make predictions while documenting history. That's the power of discrete data.
Now is the time to get SaaS-y news and entertainment with our 5-minute newsletter, G2 Tea, featuring inspiring leaders, hot takes, and bold predictions. Subscribe below!

Want to learn more about Statistical Analysis Software? Explore Statistical Analysis products.
What is continuous data?
Continuous data is a type of numerical data that refers to the unspecified number of possible measurements between two realistic points.
These numbers are not always clean and tidy like those in discrete data, as they're usually collected from precise measurements. Over time, measuring a particular subject allows us to create a defined range where we can reasonably expect to collect more data.
Continuous data is all about accuracy. So, continuous variables often carry decimal points, with the number to the right stretched out as far as possible. These decimal points offer an exact measurement between two defined data points. This level of detail is paramount for scientists, doctors, and manufacturers, to name a few. Regression analysis is one of the most common types of continuous data analysis.
When you think of experiments or studies involving constant measurements, they're likely to be continuous variables to some extent. If you have a number like "2.86290" anywhere on a spreadsheet, it's not a number you could have quickly arrived at — think of measurement devices like stopwatches, scales, thermometers, etc.
Continuous data examples
Some examples of continuous data are:
- Daily wind speed: Continuous because wind speed can take on any value within a range, including decimals.
- Freezer temperature: Continuous as it can vary and be measured to any desired level of precision, including fractions of a degree.
- Length of customer service calls: Continuous since the duration can be any value, measured to fractions of a second.
- Product box measurements and weight: Continuous as both dimensions and weight can be measured with great precision, including decimal values.
Not every example of continuous data falls neatly into a straight line. Still, a range becomes more apparent over time, and you can bet on new data points sticking inside those parameters.
How to tell if something is discrete or continuous
Both, discrete and continuous are important for statistical analysis. The key differences between them must be understood before drawing conclusions or making assumptions about the data type.
Discrete data characteristics
Discrete data is often used in simple statistical analysis because it's easy to summarize and compute. Let's look at some of the other key characteristics of discrete data.
- Finite, countable, and nondivisible: Discrete data includes discrete variables that are finite, numeric, and non-negative integers (5, 10, 15, and so on).
- Easy to visualize: Discrete data can be easily visualized and demonstrated using simple statistical methods such as bar charts, line charts, or pie charts.
- Can be categorical: Discrete data can also be categorical - containing a finite number of data values, such as the gender of a person.
- Easy to distribute: Discrete data is distributed discretely in terms of time and space. Discrete distributions make analyzing discrete values more practical.
Continuous data characteristics
Unlike discrete data, continuous data can be either numeric or distributed over date and time. This data type uses advanced statistical analysis methods considering the infinite number of possible values. Key characteristics of continuous data are:
- Changes over time: Continuous data changes over time and can have different values at different time intervals.
- May or may not have decimals: Continuous data comprises random variables that may or may not be whole numbers.
- Visualized with line graphs or skews: Continuous data is measured using data analysis methods such as line graphs and skews.
What is the difference between discrete and continuous data?
Accurately categorizing your data influences both your analysis approach and the tools you choose. If the information provided so far seems overwhelming, don’t worry—this table simplifies everything, helping you easily determine which category your data falls into.
| Discrete data | Continuous data | |
| Value | Countable and finite | Any measured value within a specific range |
| Components | Ordinal and integer data values | Quantitative data points such as fractions, decimal numbers, and percentages |
| Countability and measurability | Counted on something as simple as a number line | Measured using in-depth measurement tools and methods like curves and skews |
| Statistical analysis | Commonly used measures include the mode, median, and mean | Statistical measures include standard deviation and variance in addition to the mean, median, and mode |
| Divisibility | Nondivisible | Subdivisible |
| Granularity | Less | More |
| Nature | Remains constant over a specific time interval | Varies over time and can have separate values at any given point |
| Common examples | The number of students, the number of children, the shoe size, etc. | Height, weight, length, time, temperature, age, etc. |
| Typical applications | Manufacturing, e-commerce, and education | Finance, scientific research, and environmental monitoring |
If you're still unsure whether you're dealing with discrete or continuous data, consider asking yourself the following questions:
- Can you add up the data?
- Can you quantify the data?
- Can you break down the data and does it still make sense?
Which is it: discrete or continuous variable?
There are times when continuous variables can be treated as discrete variables. Think about it—is age discrete or continuous? Given that you know the time of birth, you can accurately measure someone's age right down to the second. Age is a continuous variable in this case. However, we don’t usually worry about someone’s exact age, so age is treated as a discrete variable, counted in years.
How to differentiate between discrete and continuous variables
The easiest way to understand the difference between discrete and continuous variables is by checking countability. Can we sit down and count all possible values of the variable? For example, you can't count every value while measuring temperature. The numbers will go on till infinity. These variables are continuous. If you're counting the number of houses in your block, you'll get discrete values.
The importance of continuous and discrete data
Just because we threw a "versus" in the title doesn't mean it's a competition (though we won't stop you from making "Team Discrete" or "Team Continuous" t-shirts).
Both continuous and discrete data are equally valuable to data collectors, and you'll encounter moments every day that lead to measurements that could contribute to either data type. Any well-rounded research is formed by combining these two unique sets of data.
Now that you know how to identify discrete and continuous data, we hope you enjoy demonstrating these skills, whether naming them with your peers or using this knowledge to inform your research.
Now that you've learned about continuous and discrete data, it's time to know the difference between structured and unstructured data — two essential data types used in statistical analysis.
This article was originally published in 2019. It has been updated with new information.

