

In today's rapidly growing technological workspace, businesses have more data than ever before.
Having mass amounts of data means nothing; what you do with that data is what matters. That’s where data mining comes in. It makes sense of data as businesses work to implement various goals and potential improvement strategies through the process of turning raw data into actionable insights. There are many ways to go about this, and it all comes down to the data mining techniques your business chooses to use.
Data mining is the process of finding and detecting patterns in data for relevant insights; the various techniques are how you go about turning raw data into accurate observations.
Common data mining techniques
A variety of data mining techniques are often required to uncover insights that lie within big datasets, so it would make sense to choose more than one. While data mining can segment customers, it can also help determine customer loyalty, identify risks, build predictive models, and much more.
Most, but not all, data mining techniques either fall under the statistical analysis or machine learning category, depending on how they are used. Below, we dive more into each technique.
Data cleaning
A necessary technique when it comes to data mining is data cleaning. Raw data must be cleaned, formatted, and analyzed for it to be useful and applied to different types of analytical methods. This technique is part of different elements of data modeling, transformation, aggregation, and migration.
How is data cleaning used today?
Businesses use data cleaning as a first step in the data mining process because otherwise, the data found is useless and unreliable. There needs to be trust in the data, and the results that come from data analytics, for there to be a worthwhile and actionable next step. Data cleaning is often the first step that is conducted in the data mining process.
Clustering
One data mining technique is called clustering analysis, otherwise referred to as numerical taxonomy. This technique essentially groups large quantities of data together based on their similarities. This mockup shows what a clustering analysis may look like.
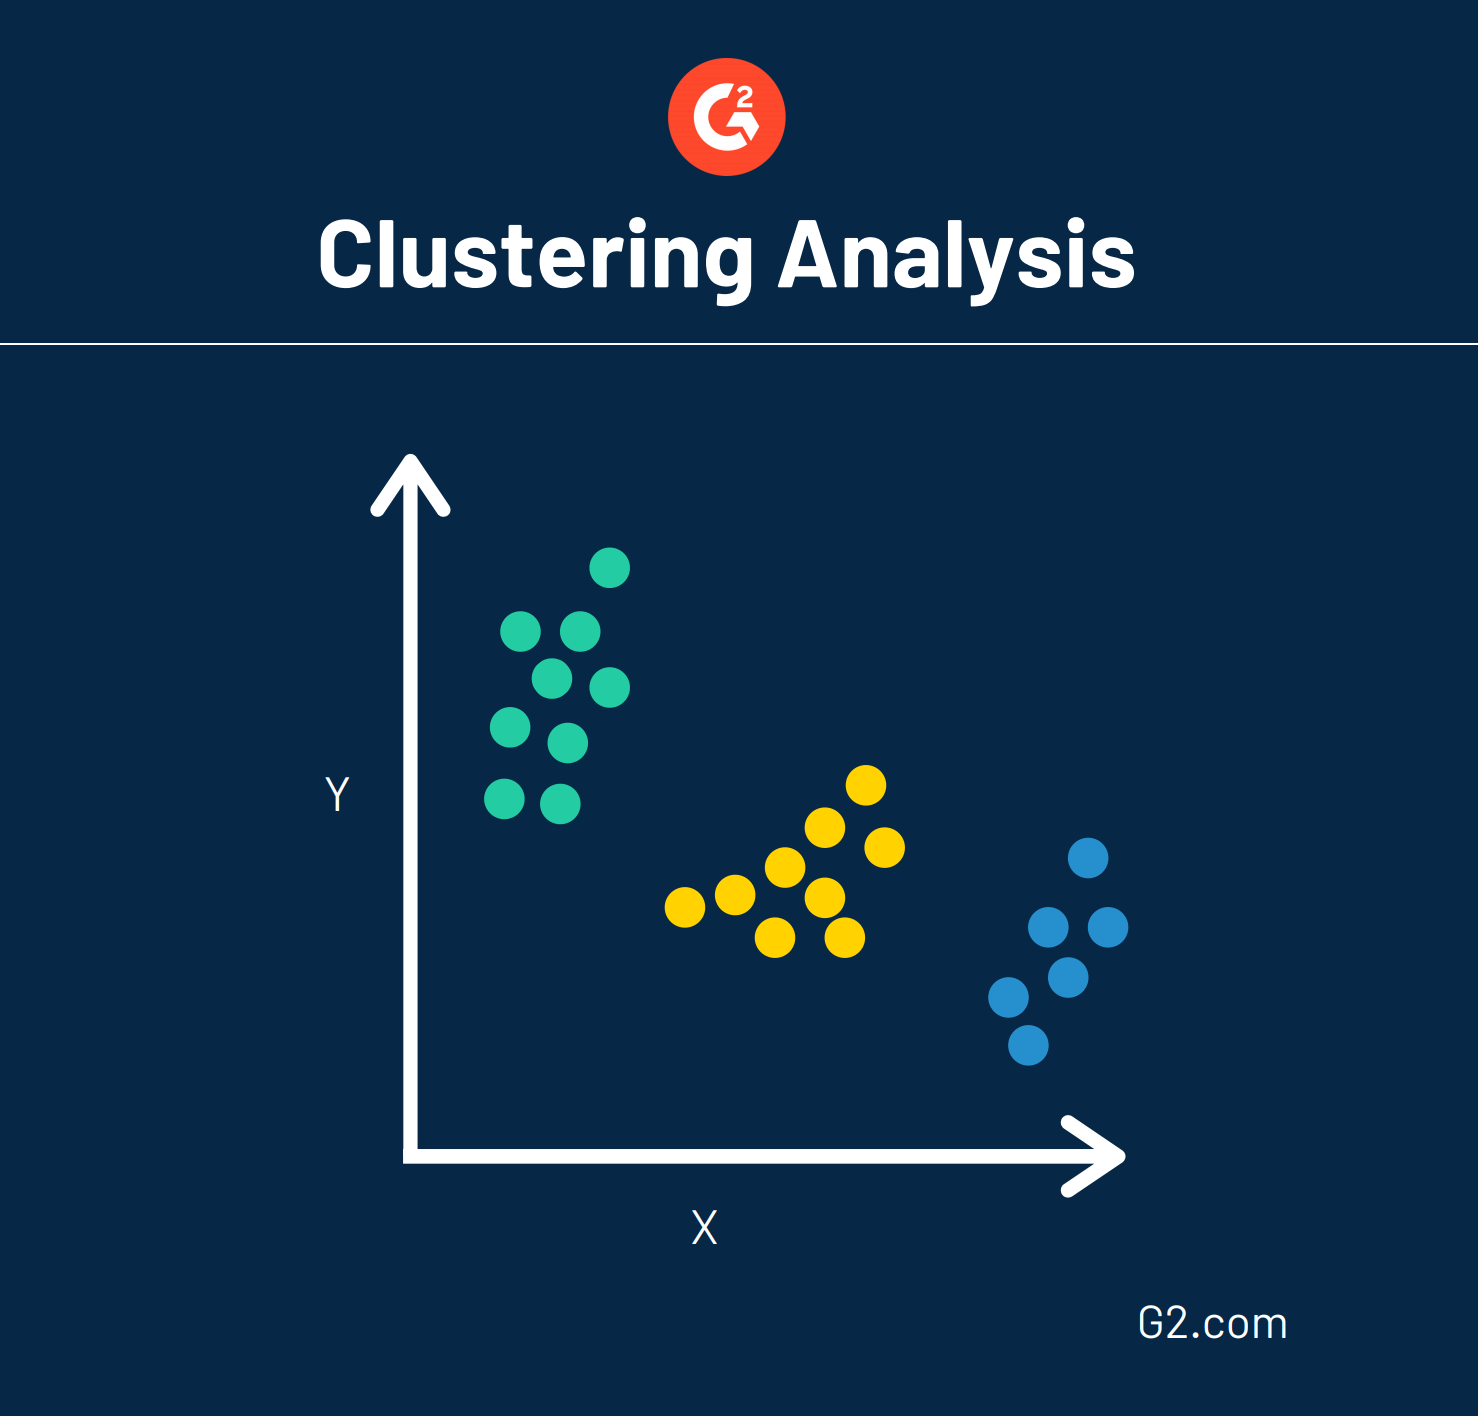
Data that is sporadically laid out on a chart can be grouped in strategic ways through clustering analysis. This analysis can also act as a preprocessing step, which means data is formatted in a way so other techniques can be easily applied.
When it comes to clustering approaches, there are five major methods used by data scientists:
- Partitioning algorithms: creating various partitions and then evaluating them based on specific criteria
- Hierarchy algorithms: creating a hierarchical disposition of the data set using specific criteria
- Density-based: based on connectivity and density functions
- Grid-based: based on multiple-level granularity structures
- Model-based: a model is first hypothesized for each of the clusters, then the best fit of the model is found
Going hand-in-hand with these clustering approaches are five clustering algorithms used to classify each data point into a specific group. Data points within the same group have similar properties or features.
These algorithms are:
- K-Means Clustering: groups observations into clusters where each data point is part of the cluster with the nearest mean
- Mean-Shift Clustering: assigns the data points to the clusters iteratively by shifting points towards the mode. Most commonly used in image processing and computer vision
- Density-Based Spatial Clustering of Applications with Noise (DBSCAN): groups together data points in a specific space that are close together while marking specific outlier points in low-density regions within the cluster. Frequently cited in scientific literature
- Expectation-Maximization (EM) Clustering with Gaussian Mixture Models (GMM): used to cluster unlabeled data as it accounts for variance (width of a bell curve) to determine the shape of the distribution or cluster
- Agglomerative Hierarchical Clustering: works to build a hierarchical analysis of the clusters with a “bottom-up” approach. Each observation will start in its own cluster, and pairs of clusters are merged as one moves up the hierarchy
What is clustering used for?
There are a few ways to draw knowledge out of clustering analysis. Insurance companies can identify groups of policyholders with high average claims. Clustering can be used in marketing to segment customers based on benefits they’ll experience when purchasing a specific product.
Another example of clustering is how seismologists can see the origin of earthquake activity and the strength of each earthquake, then apply that insight for designing evacuation routes.
Classification
Classification is often referred to as a subset of clustering. Classification consists of analyzing various attributes that are associated with varying types of data. When a business can identify the main characteristics of these data types, they can better organize and classify all data that is related.
This is a vital part of identifying specific types of data, like if a business wants to further protect documents with sensitive information, like social security or credit card numbers.
Outlier detection
Also known as anomaly detection, this data mining technique does perhaps the opposite of clustering. Instead of searching for large groups of data that could be clustered together, outlier detection looks for data points that are rare and outside an established group or average.
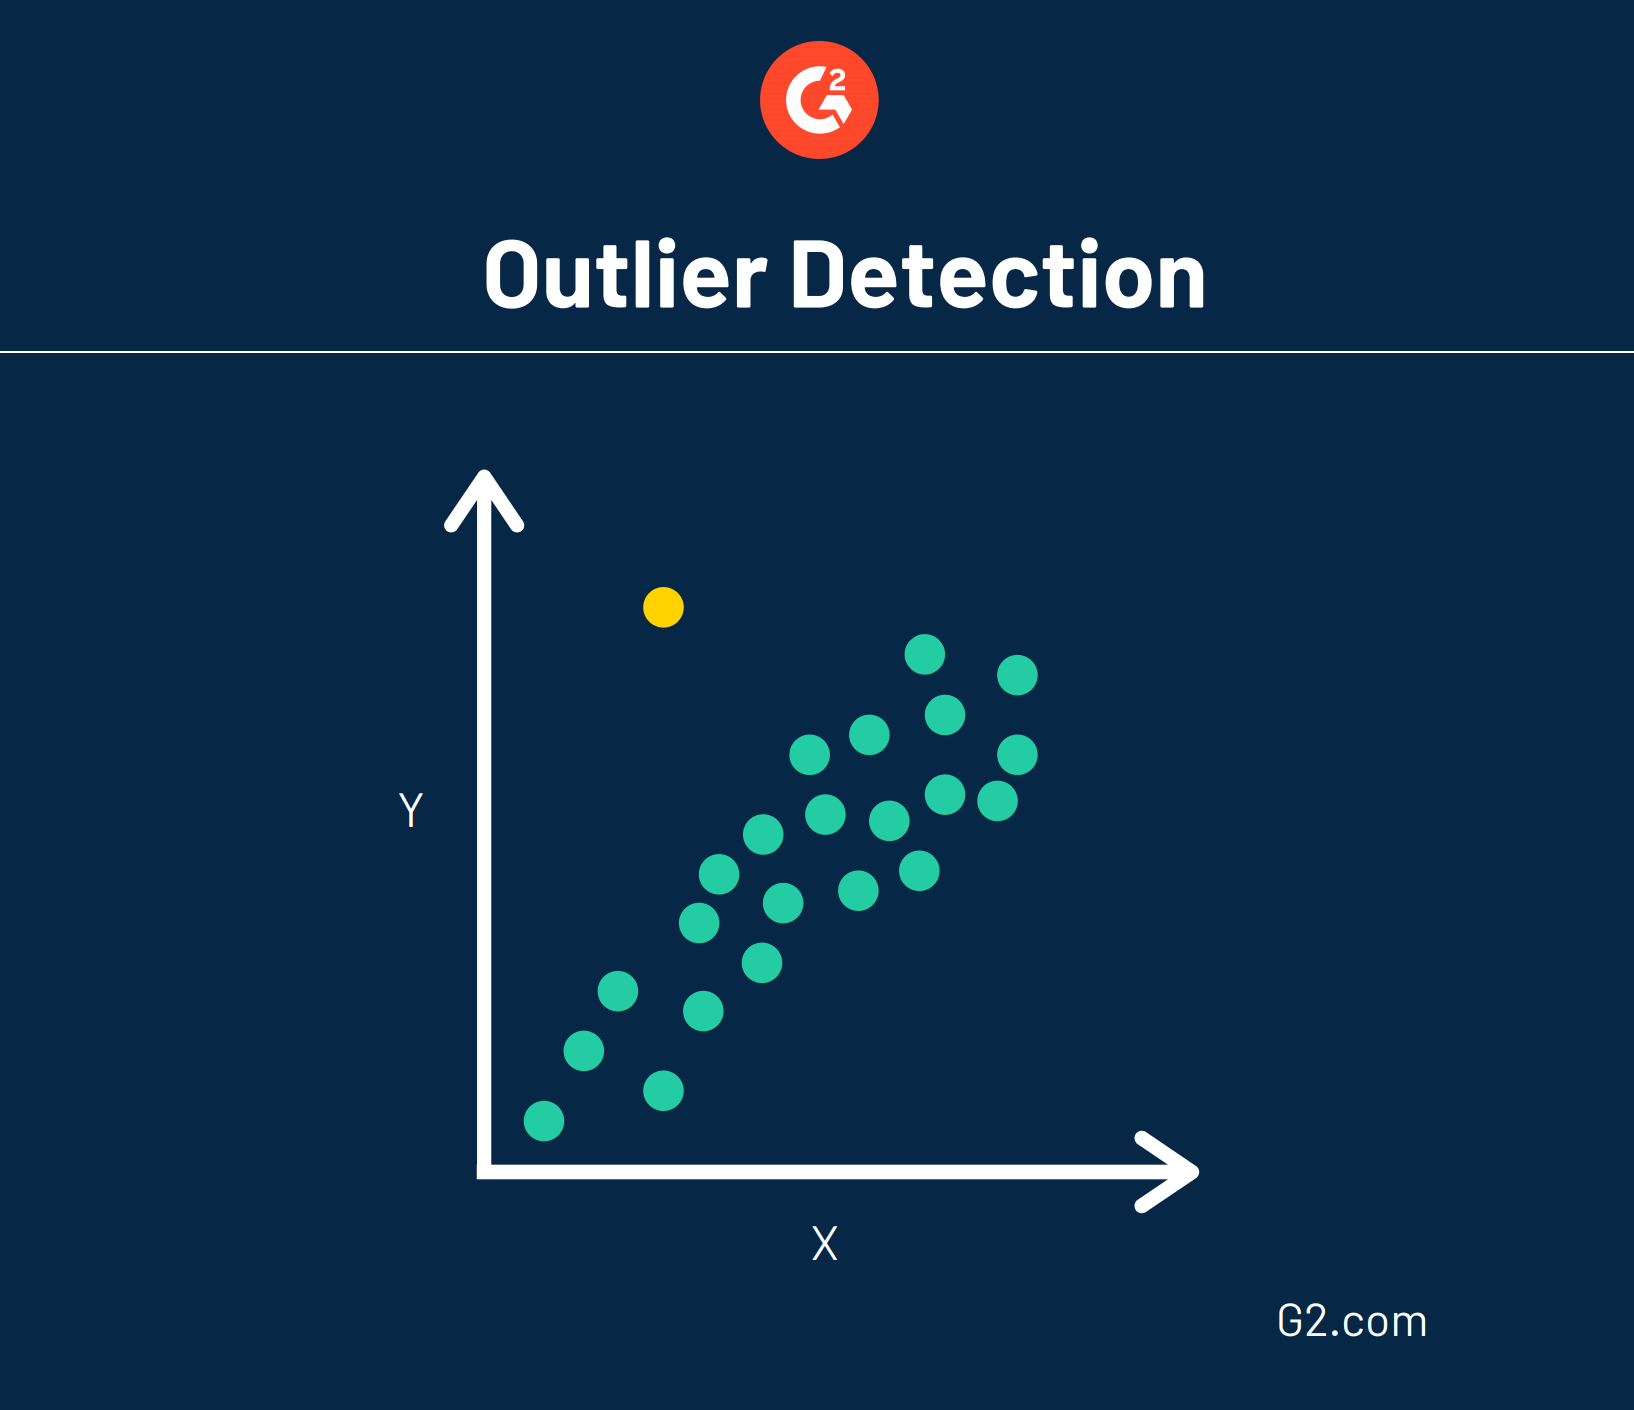
Because data is pretty random, anomalies don’t necessarily point toward a trend. Instead, data that goes against the grain could indicate something abnormal is going on and requires further analysis.
Once a business or organization finds these oddities within the data, it becomes easier to understand why these anomalies happen and prepare for any that may arise in the future.
There are two types of outliers:
- Univariate: a data point that consists of extreme value on one variable
- Multivariate: a combination of unusual scores on at least two variables
Of these two types, there are four outlier techniques:
- Numeric Outlier: outlier detection in a one-dimension space
- Z-Score: parametric outlier detection in a one- or low-dimensional space
- DBSCAN: the density-based outlier detection in a one- or multi-dimensional space
- Isolation Forest: non-parametric method for large datasets in a one- or multi-dimensional space
What is outlier detection used for?
Outlier detection is most commonly used in detecting fraudulent behavior. For example, outlier detection can identify suspicious credit card activity and trigger a response (such as an account freeze).
In an age where cyber attacks are more robust and common than ever, outlier detection helps identify data breaches on websites so they can be quickly resolved. This is called intrusion detection.
Association rule mining
Looking for groups and outliers are a few ways to mine for knowledge, but another technique called association rule mining looks at how one variable relates to another as it discovers a hidden pattern in the data set.
Data scientists look for specific events or attributes that are highly correlated with another event or attribute. The insight from association rule mining can also help businesses identify potential correlations. For example, if event A occurs, then event B is likely to follow. If event A is a snowstorm, we can assume that event B, the cancellations of flights, is likely to come next. If you’ve ever been suggested products on an e-commerce site based on what’s in your cart, then you’ve seen association rule mining at work.
For instance, this is what Amazon recommends I purchase based on items I have purchased in the past.

What is association rule mining used for?
Walmart applied this data mining technique flawlessly in 2004 during Hurricane Frances. By mining transaction and inventory data, analysts discovered that strawberry Pop-Tart sales were seven times higher right before the hurricane hit. Beer was also revealed as the top-selling pre-hurricane item. With this information at-hand, Walmart was sure to stock up. Like Walmart, small and medium-sized businesses can use this data in the same way.
Regression
If a business is looking to make a prediction based on the effect one variable has on others, they may refer to a data mining technique called regression analysis. This data method identifies and analyzes the relationship between variables.
Remember: Regression and association are often confused for one another. Statistical analysis regression is the equation used to specify and associate data for two or more variables. Association is the relationship between two measured quantities that will render them dependent or correlated.
What is regression used for?
On the surface, data is chaotic. There’s a lot of trial and error involved when examining the relationship between one set of data and another – especially when a business is trying to figure out event probabilities and make predictions. Regression analysis can steer these predictions in the right direction.
An example of regression analysis in the healthcare industry is examining the effects that body mass index, or BMI, has on other variables. You’d also use regression to determine how the price of a product will impact the number of sales your business has or how the amount of rainfall will impact the growth of crops.
Linear regression
One common type of regression is called linear regression.
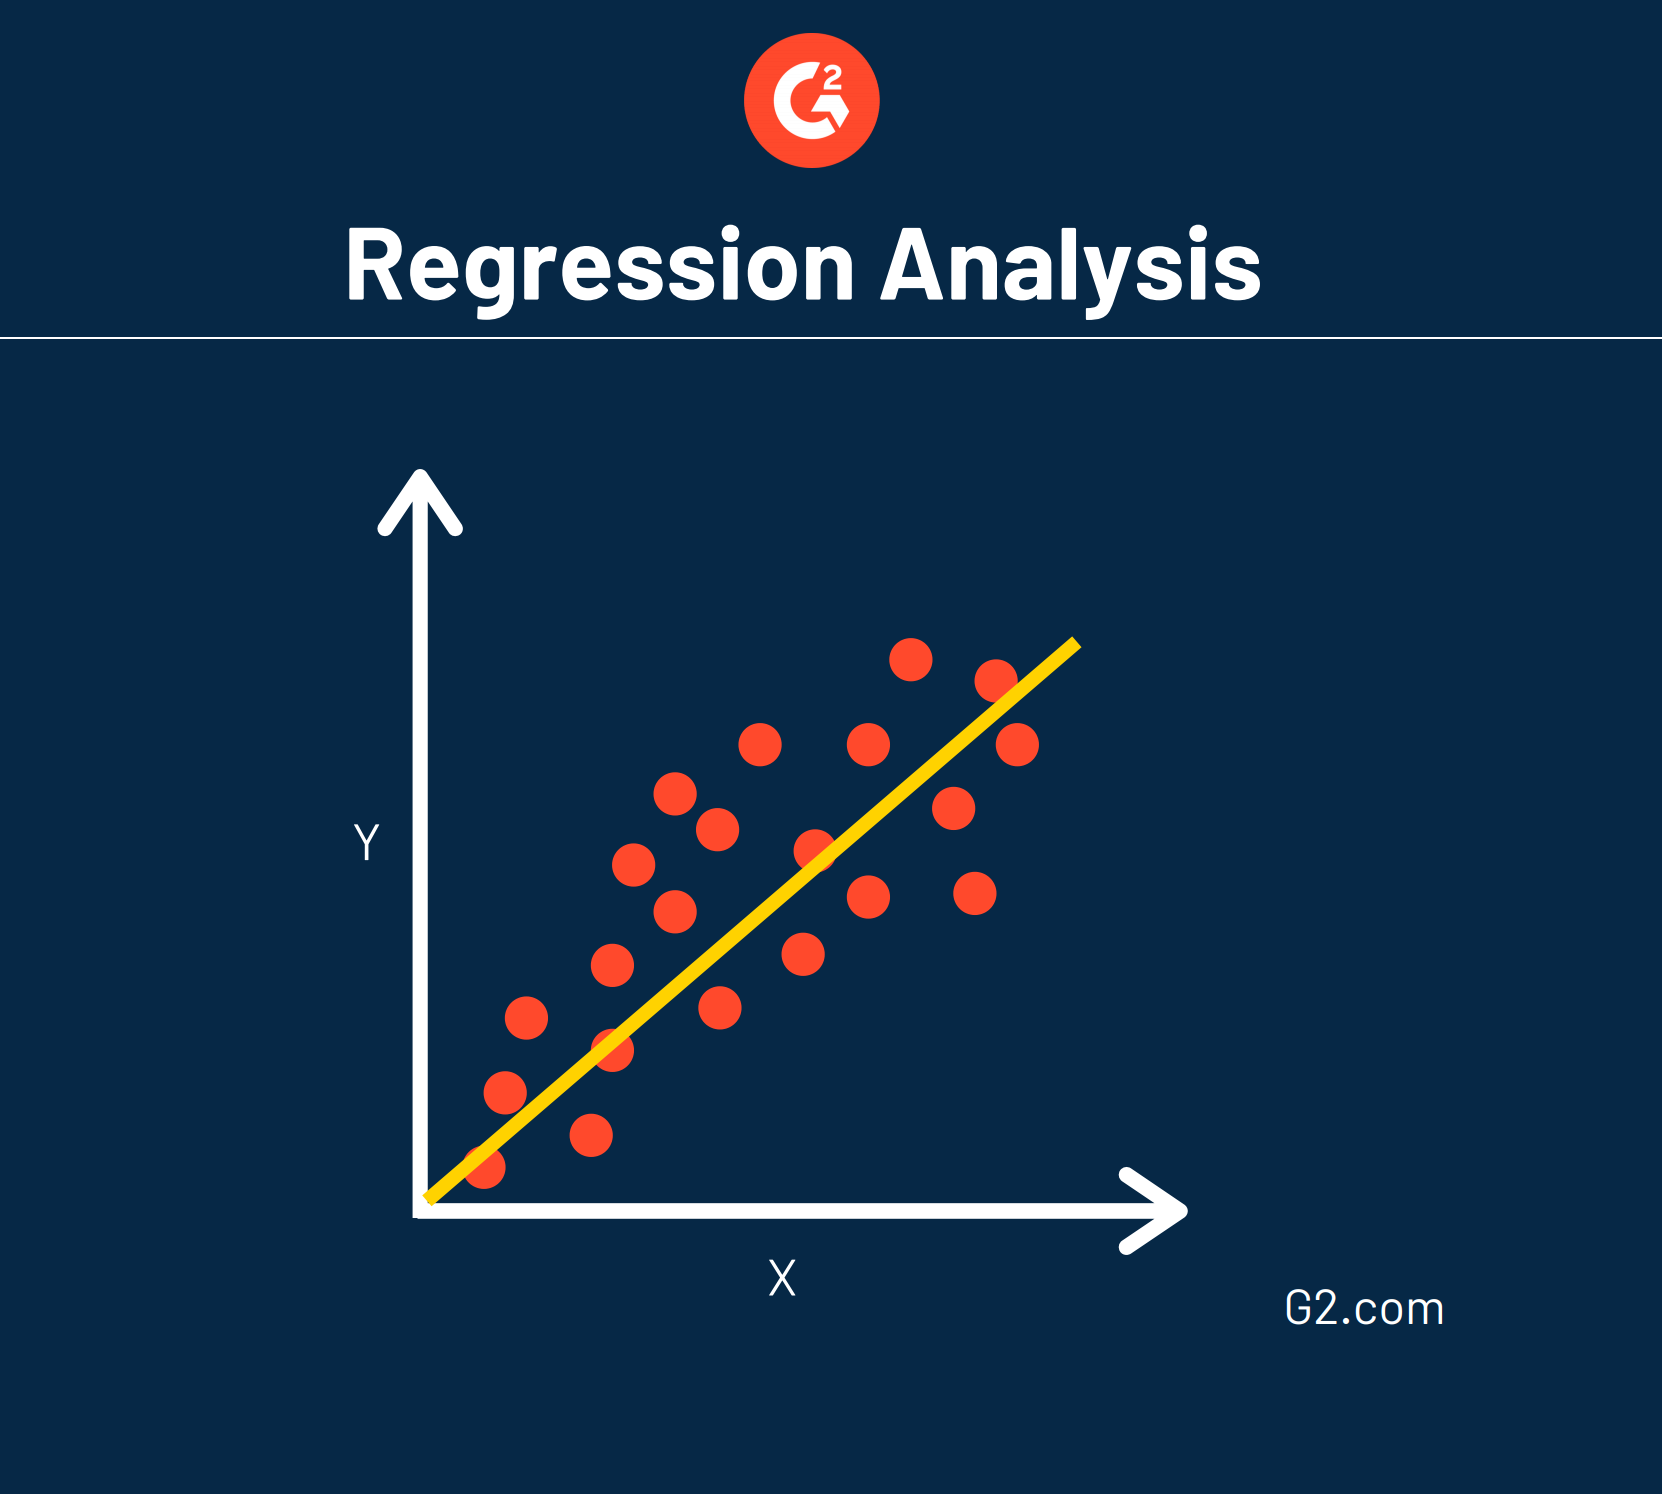
This means a straight line can be drawn to show how each variable relates to one another.
Related: Learn more about regression, the difference between correlation vs regression, and when you should use these two statistical measurements.
Decision tree
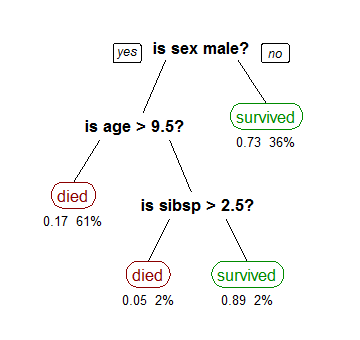
One of the more visual data mining techniques is called decision tree analysis, and it is a popular method for important decision making.
Source: Research Gate
There are two types of decision tree analyses. One of them is called classification, which is what you see in the example above determining whether or not a passenger would have survived on the Titanic. Classification is logic-based, using a variety of if/then or yes/no conditions until all relevant data is mapped out.
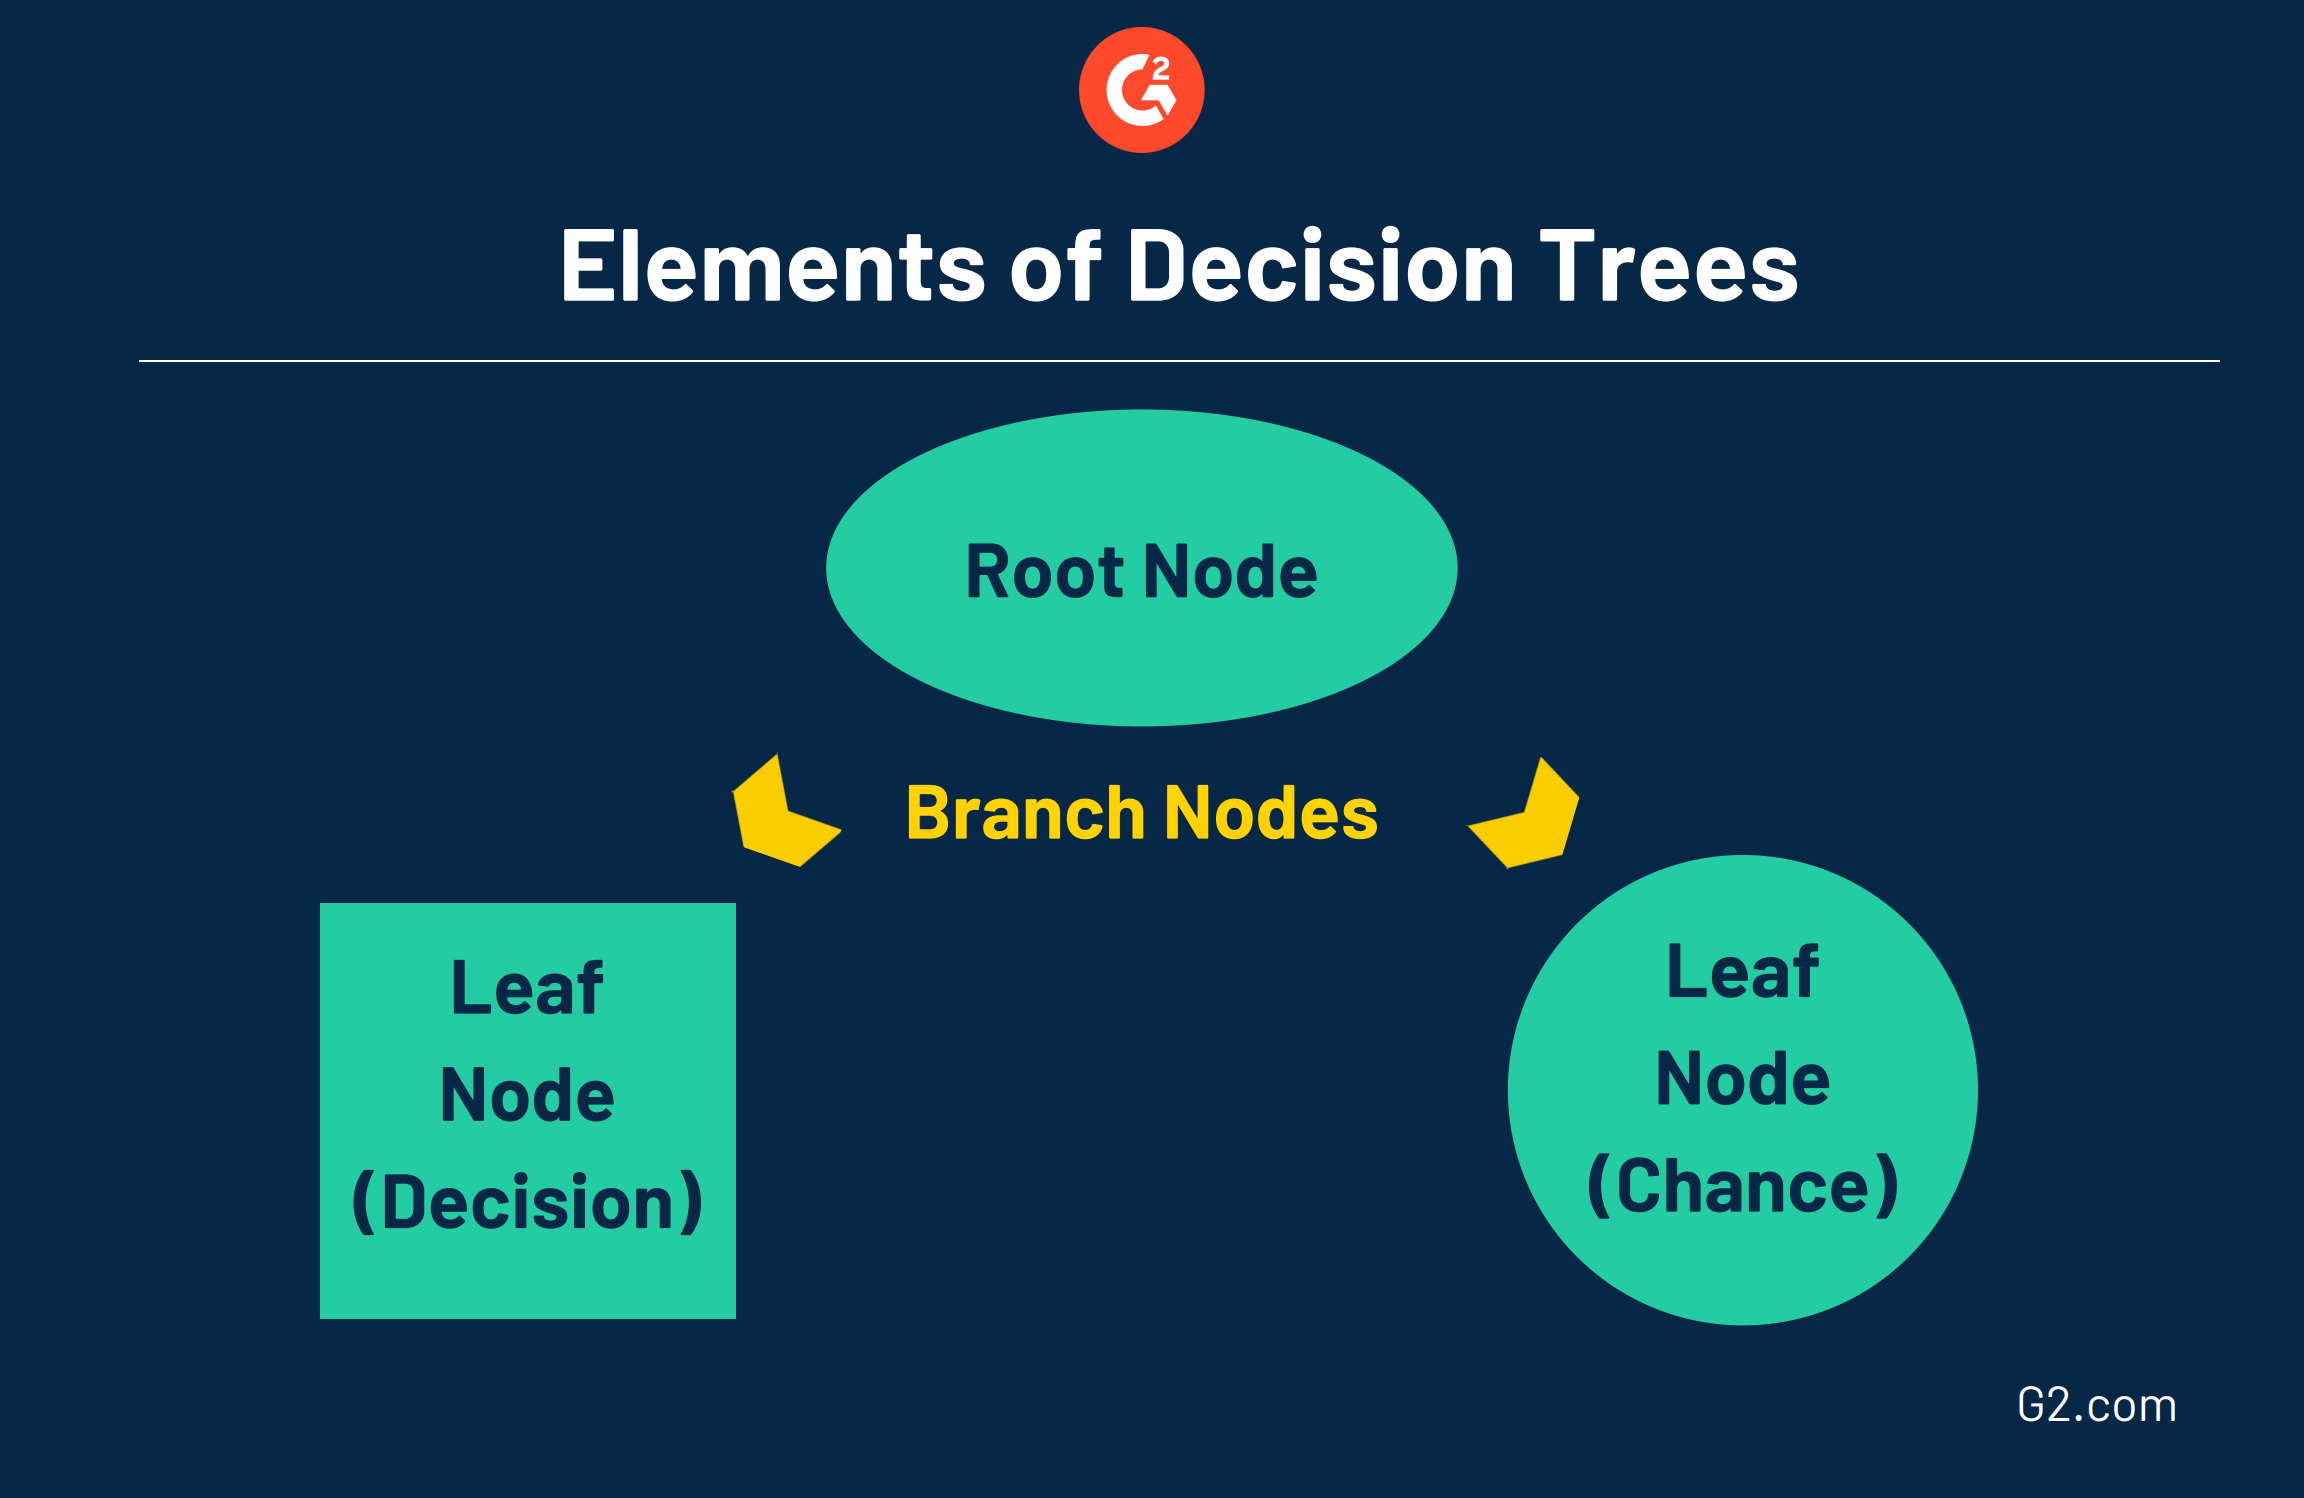
These trees consist of three different elements:
- Root Node: the top-level node that represents the ultimate objective or decision you’re trying to make.
- Branches: stemming from the root, branches represent different options or courses of action, which are commonly represented by an arrow.
- Leaf Node: attached to the end of the branches, leaf nodes represent the possible outcomes for each action. A square node indicates that another decision needs to be made, while a circle leaf node indicates a chance event or unknown outcome.
The other decision tree is called regression, which is used when the target decision is a numerical value. For example, regression could be used when determining a house’s value. Both decision trees can be run through machine learning programs.
Unsure which machine learning software to run your decision tree through? Take a look at hundreds of unbiased reviews brought to you free from G2!
A decision tree enables a user to clearly understand how the data inputs affect the outputs. When more than one decision tree is combined for a prediction analysis, this becomes what is known as a random forest. When a random forest model becomes too complex, it is referred to as a black box machine learning technique because it’s difficult to understand their outputs based on the inputs.
Prediction
As the name suggests, prediction or predictive analysis uses a combination of other data mining techniques, like clustering and classification, to analyze past events or instances in the right sequence to predict a future event.
In most cases, recognizing and understanding historical trends is enough to charge an accurate prediction of what could happen in the future. There are many approaches to prediction analysis, from machine learning to artificial intelligence. However, accurate predicting doesn’t depend on these two techniques; it can also be determined using various algorithms.
What is prediction used for?
Many organizations use prediction for insight into what trends will happen next within their data. Like outlier detection, predictive analysis can also detect fraud, zero-day vulnerabilities, and persistent threats. One specific example is how Staples used prediction to analyze behavior and provide a complete picture of their customers, which resulted in a 137% increase in ROI.
Data visualization
Data visualization works to give users additional insights into their information by using charts and graphs in real-time to better understand performance goals. This technique is popular because of the fact that data visualization is able to consume data from any source through file uploads, database querying, and application connectors.
How is data visualization used today?
Thanks to the dashboards created using data visualization software, finding various insights, trends, and KPIs into data is easier than ever. Many of these tools provide drag-and-drop functionality and other non-technical capabilities, so the average business user can build necessary dashboards.
This type of software is used by C-level executives, and teams within the sales, marketing, custom service, and human resource sectors. As an example, those on your sales team would use this software to track revenue numbers on deals they have closed, while marketing teams use these tools to analyze web traffic, email campaigns, and social media impressions.
Related: Learn more about the 67 types of data visualizations your company can use to see the bigger picture.
Neural networks
Neural learning is a specific type of machine learning model and statistical technique that is often used in conjunction with artificial intelligence and deep learning, and are some of the most accurate machine learning models we use today.
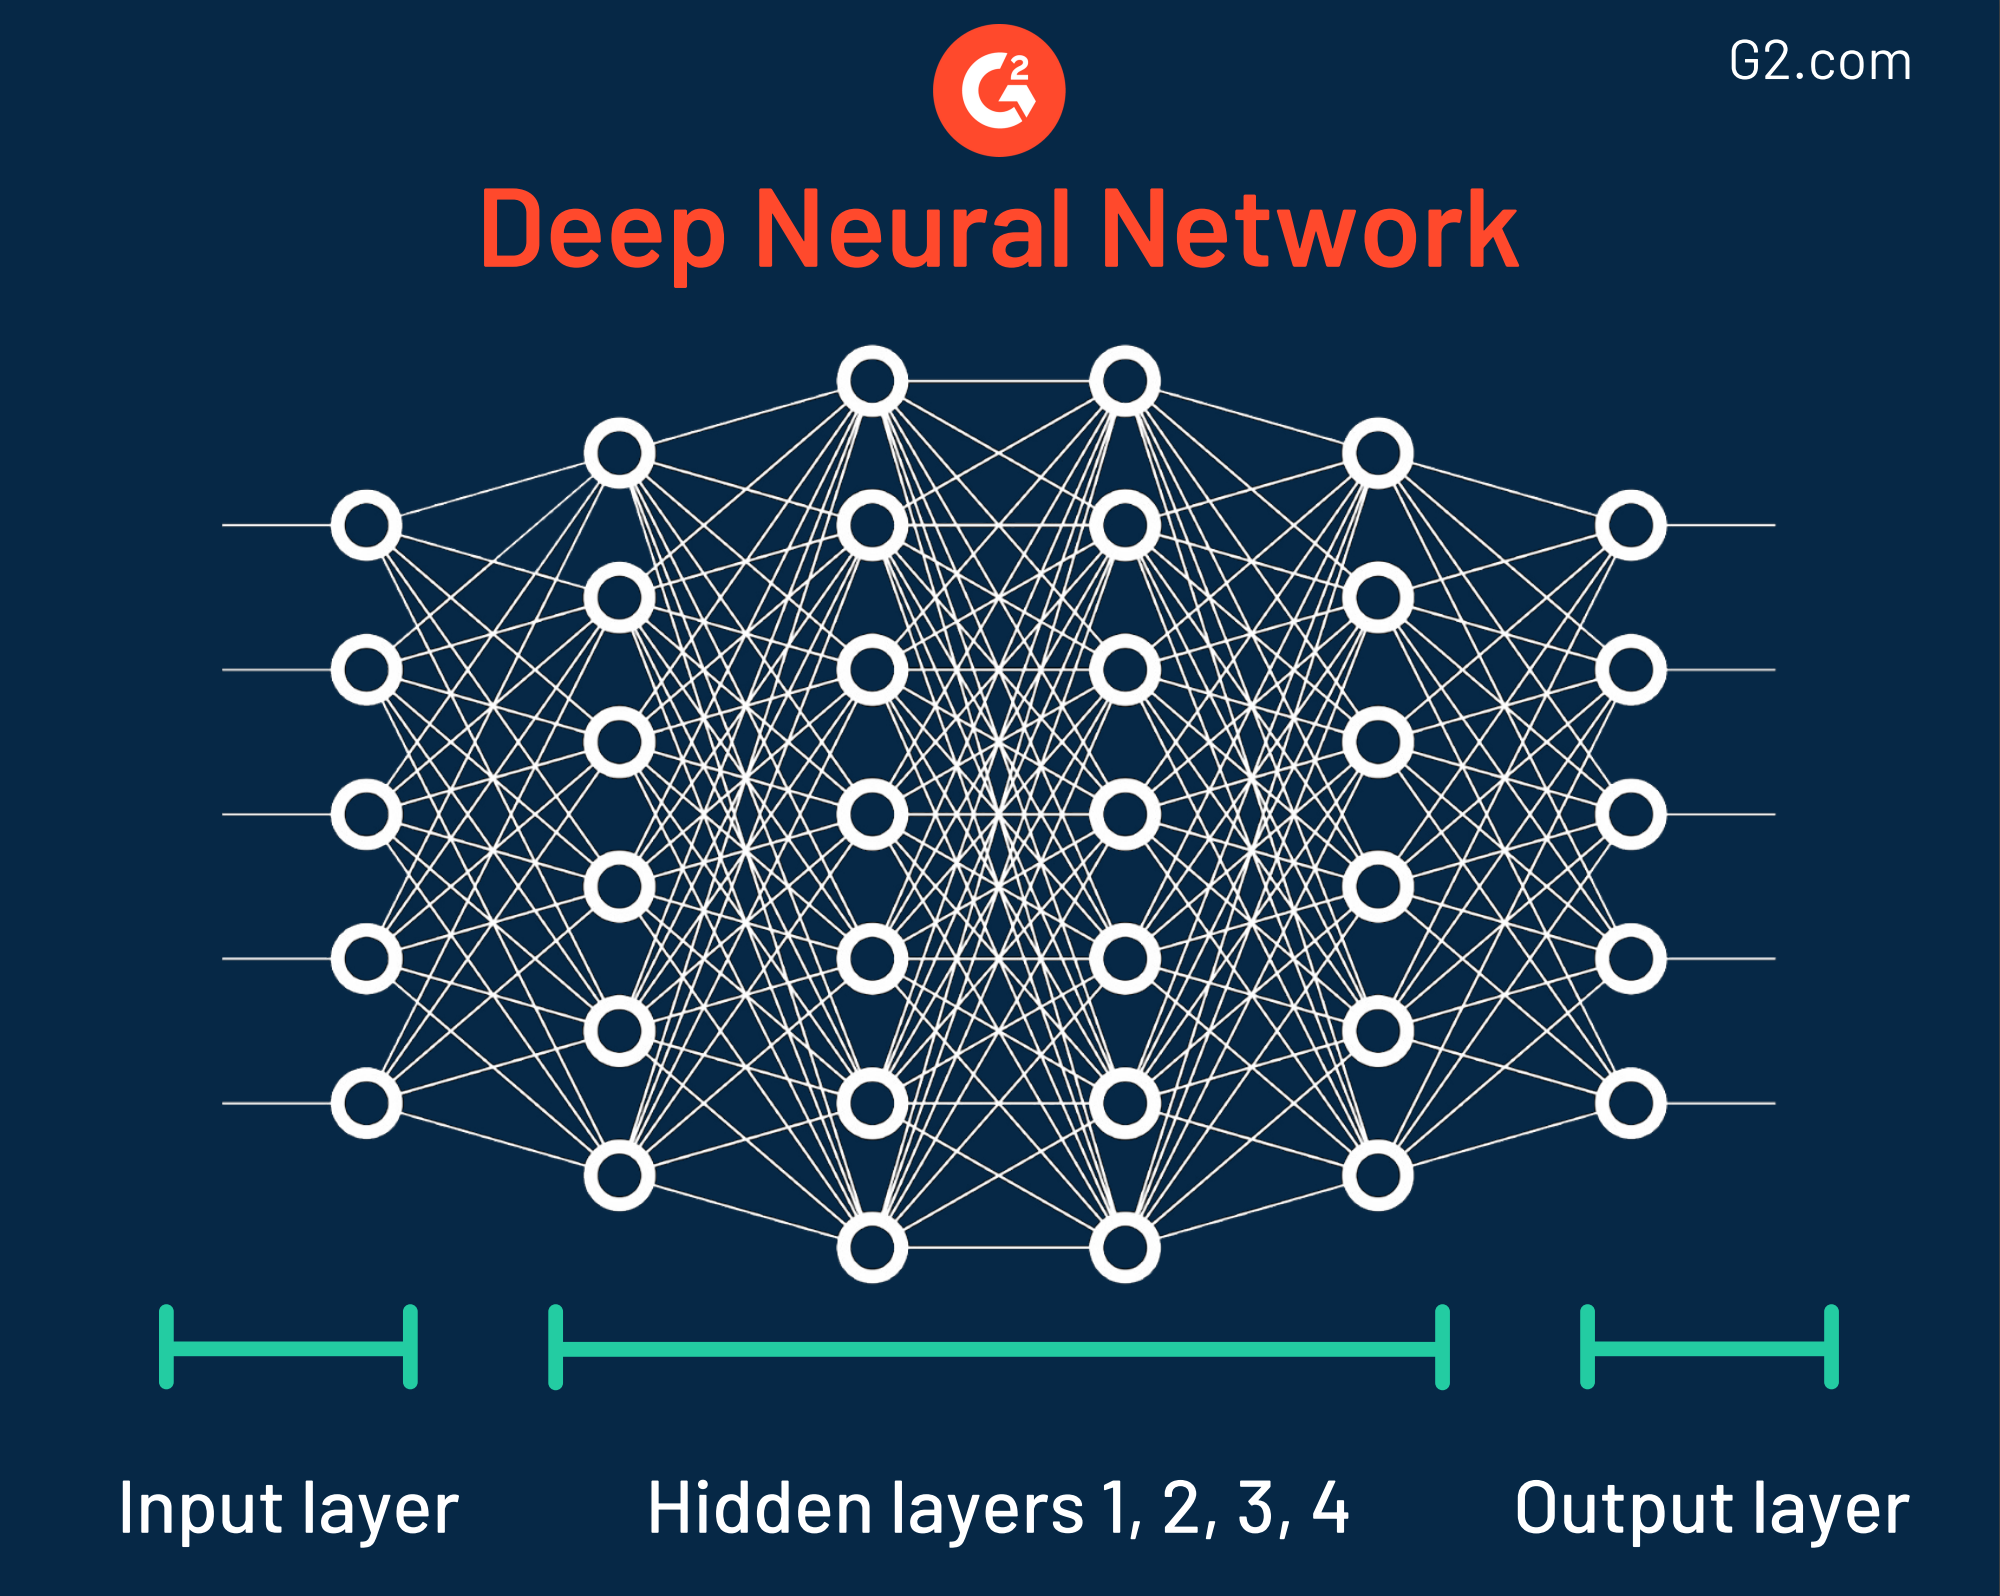
This data mining technique was named when it was discovered in the 1940s because it has different layers, all resembling the ways neurons work in the human brain. Despite its accuracy, organizations using neural networks should be wary of the fact that some of these models are extremely complex, which makes it challenging to understand how the output is determined.
In fact, some neural networks are so wildly intricate they have as many as 150 hidden layers. Each layer plays a key role in breaking down features of raw data. This is formally called feature extraction.
How are neural networks used today?
Neural networks with only a few layers are used across banks and post offices to recognize handwriting styles. This comes in handy when cashing checks with your mobile phone.
More complex neural networks with many layers are being used right now to develop driverless cars. Extracting elements from the road, recognizing crosswalks and traffic signs, and understanding movement patterns of other vehicles are just a few of the many types of raw data being broken down piece-by-piece in complex neural networks.
Principal component analysis
The data mining technique principal component analysis (PCA) is used to illustrate hidden connections between input variables as it creates new variables that visualize the same information captured using original data but with fewer variables. Essentially, this method combines correlated information to form a smaller number of variables called “principal components” that make up for most variance in the data.
The point of reducing the number of variables, while still conveying the same amount of information, is so data analysts can enhance the accuracy of supervised data mining models. Essentially, it makes your data easy to explore and visualize.
How is principal component analysis used today?
PCA is most commonly used by those in the finance sector by those who conduct and analyze various interest rates. Those working with stocks and the stock market also use PCA to determine which stocks to trade, and when.
Tracking patterns
When it comes to data mining techniques, tracking patterns is a fundamental one. Tracking patterns involves identifying and monitoring trends and patterns in data to make a smart and calculated presumption about business outcomes.
When are tracking patterns used today?
Let’s say an organization identifies a trend in their sales data and uses it as a starting point to capitalize on a specific insight. If the data shows that a certain product is selling better than others for a particular demographic, they may decide to use that data to create similar products or services. Similarly, they could choose to better stock the original product for that demographic.
Data warehousing
Otherwise known as enterprise data warehousing, data warehousing involves storing structured data in relational database management systems so that it can be analyzed for the use of reporting and business intelligence. The data mining and data warehousing techniques of today utilize both cloud data warehouses for more secure storage of these insights.
The information stored in these warehouses can be used for:
- Tuning production strategies: comparing sales of products either quarterly or annually to manage portfolios and reposition products
- Customer analysis: taking a deeper look into the customer’s buying preferences, budget cycles, buying time, and more
- Operations analysis: helping to analyze business operations, customer relationships, and how to make proper environmental connections
How is data warehousing used today?
The investment and insurance industries use data warehousing to analyze data patterns, customer trends, and to track market movements. Those in retail use data warehouses to track items, customer buying patterns, promotions, and for determining pricing policy.
Discover the unknown
Using the right data mining technique is sure to provide unprecedented insight into your wealth of data. As technology becomes more advanced, data mining will only continue to grow and find more in-depth insights.
Roll up your sleeves and take a deep dive into what your data is showing you; you might be surprised by what you find.
Take all of this knowledge one step further and learn about business analytics and how it can be used to achieve success.
Want to learn more about Machine Learning Software? Explore Machine Learning products.
Mara Calvello
Mara Calvello is a Content and Communications Manager at G2. She received her Bachelor of Arts degree from Elmhurst College (now Elmhurst University). Mara writes customer marketing content, while also focusing on social media and communications for G2. She previously wrote content to support our G2 Tea newsletter, as well as categories on artificial intelligence, natural language understanding (NLU), AI code generation, synthetic data, and more. In her spare time, she's out exploring with her rescue dog Zeke or enjoying a good book.

