
Businesses generate and store tons of data every day, but what happens to this data after it’s stored?
The short answer is that most of it sits in repositories and is almost never looked at again, which is quite counterintuitive.
The problem isn’t the lack of data available but the ambiguity in determining how exactly the data should be analyzed and used. To clear up any uncertainties, businesses should understand the data analysis process to make informed business decisions.
What is data analysis?
The data analysis process entails inspecting, cleansing, transforming, and modeling data. It discovers useful information, draws conclusions, and supports decision-making. This process also empowers organizations to predict trends and enhance operational efficiency.
Data can hold valuable insights into users, customer bases, and markets. When paired with analytics software, data can help businesses discover new product opportunities, marketing segments, industry verticals, and much more.
Now that you have a general overview of the data analysis process, it’s time to examine each step in more detail.
Data analysis techniques
Data analysts can use many data analysis techniques to extract meaningful information from raw data for real-world applications and computational purposes. Some of the notable data analysis techniques that aid a data analysis process are:
Exploratory data analysis
Exploratory data analysis is used to understand the messages within a dataset. This technique involves many iterative processes to ensure that the cleaned data is further sorted to understand its useful meaning better. Data visualization techniques, such as analyzing data in an Excel sheet or other graphical format, and descriptive analysis techniques, such as calculating the mean or median, are examples of exploratory data analysis.
Using algorithms and models
Algorithms have become an integral part of today's data environment. They include mathematical calculations for data analysis. Mathematical formulas or models, such as correlation or causation, help identify the relationships between data variables.
Modeling techniques such as regression analysis analyze data by modeling the change in one variable caused by another. For example, determining whether a change in marketing (independent variable) explains a change in engagement (dependent variable). Such techniques are part of inferential statistics, the process of analyzing statistical data to draw conclusions about the relationship between different sets of data.
Want to learn more about Analytics Platforms? Explore Analytics Platforms products.
What are the 5 steps of the data analysis process?
The data analysis process is a collection of steps required to make sense of the available data. Identifying the critical stages is a no-brainer. However, each step is equally important to ensure that the data is analyzed correctly and provides valuable and actionable information.
Let's take a look at the five essential steps that make up a data analysis process flow.
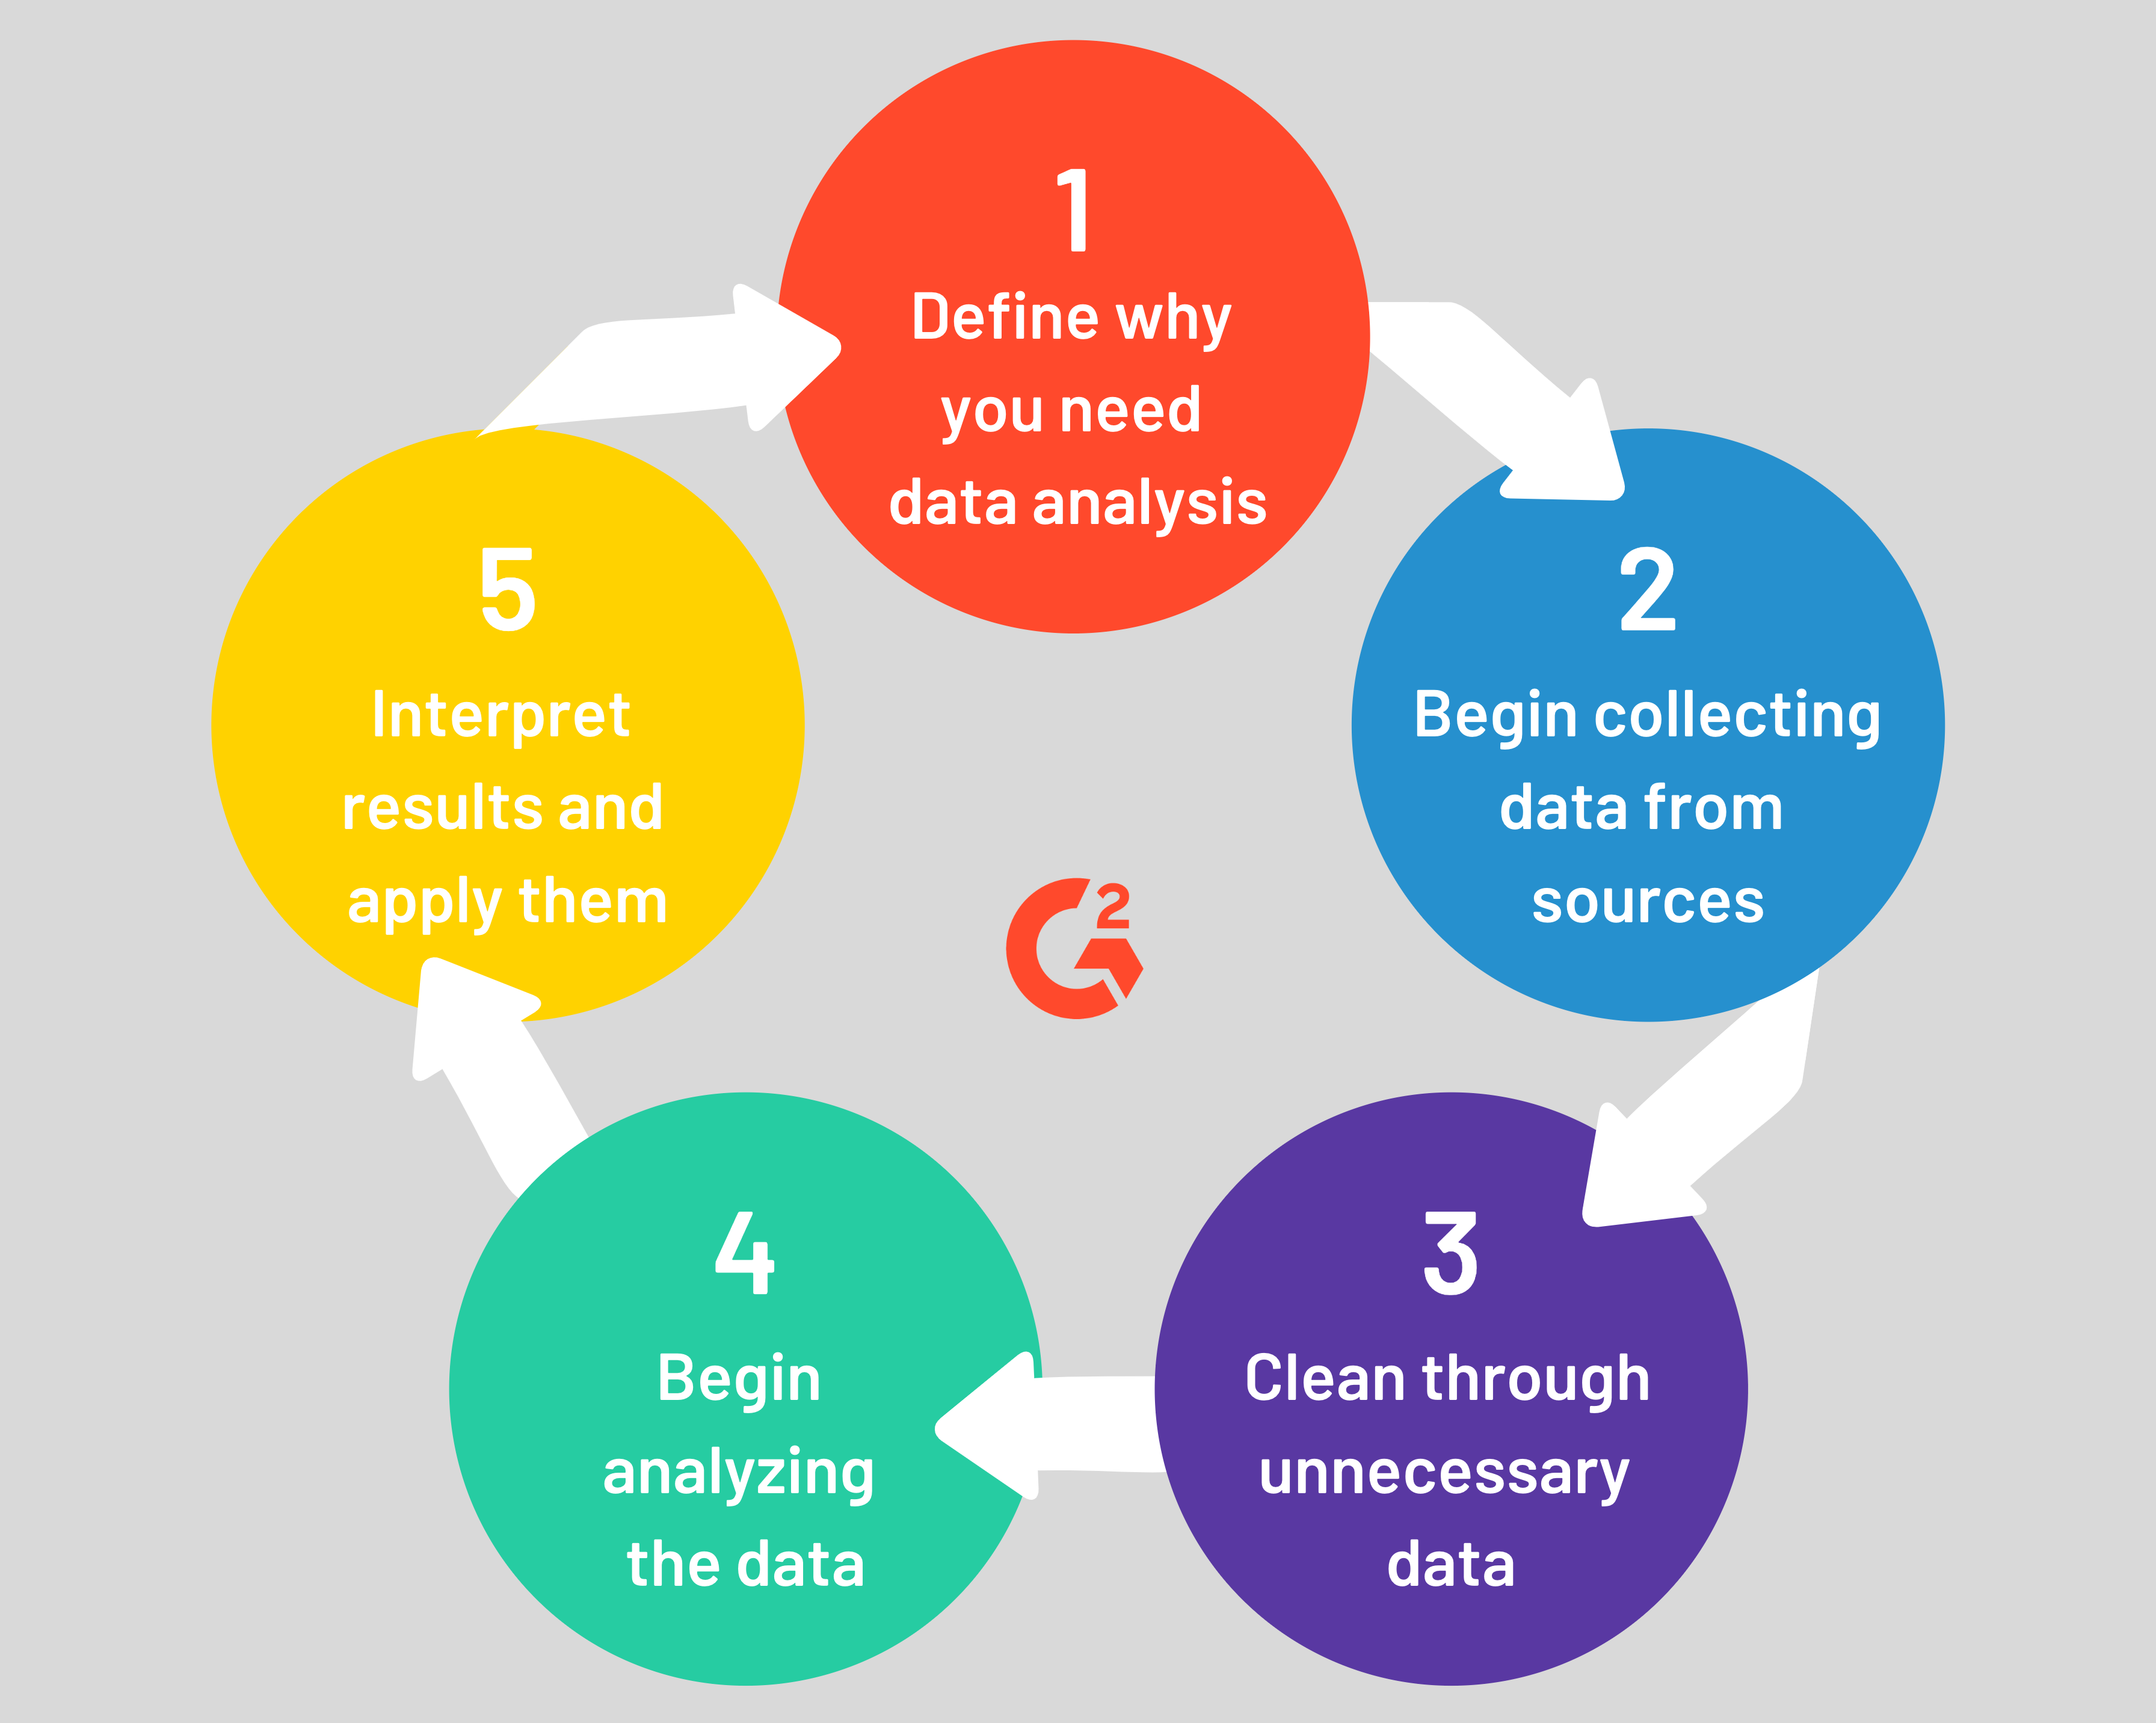
Data analysis step 1: Define why you need data analysis
Before getting into the nitty-gritty of data analysis, a business must first define why it requires a well-founded process in the first place. The first step in a data analysis process is determining why you need data analysis. This need typically stems from a business problem or question, such as:
- How can we reduce production costs without sacrificing quality?
- What are some ways to increase sales opportunities with our current resources?
- Do customers see our brand positively?
In addition to finding a purpose, consider which metrics to track along the way. Also, be sure to identify sources of data when it’s time to collect.
This process can be long and arduous, so building a roadmap will greatly prepare your data team for all the following steps.
Data analysis step 2: Collect data
After a purpose has been defined, it’s time to begin collecting the data needed for analysis. This step is important because the nature of the collected data sources determines how in-depth the analysis is.
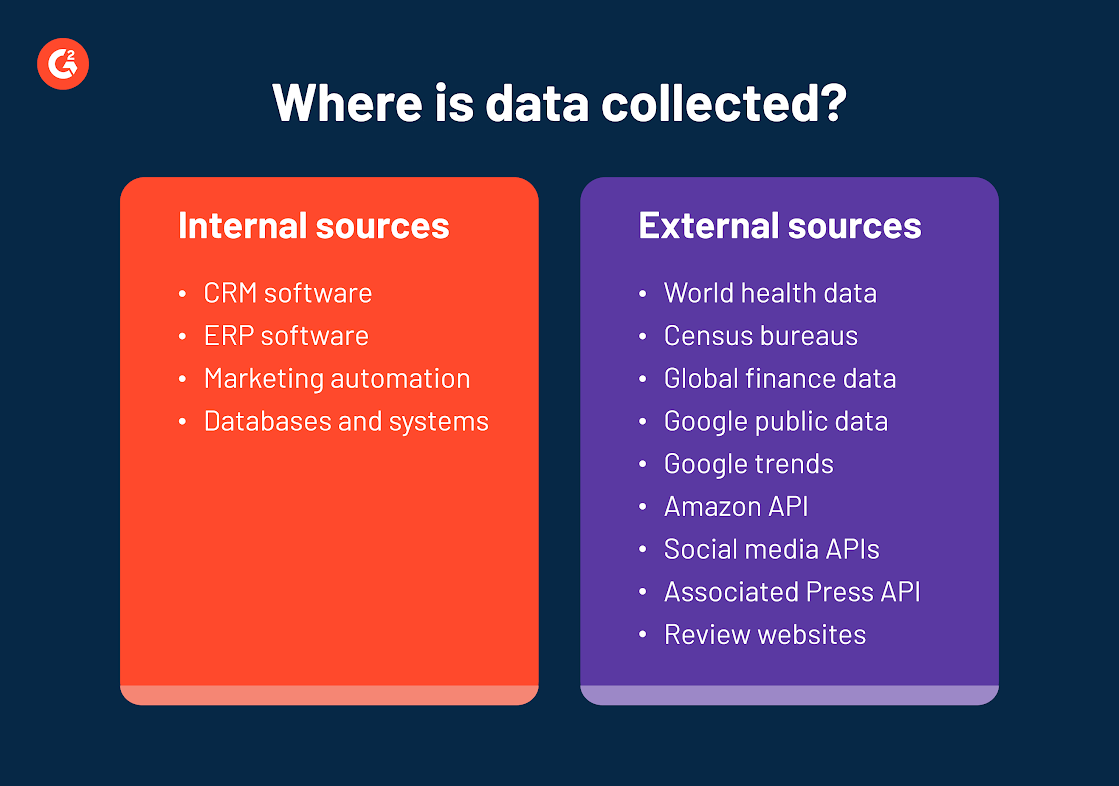
Data collection starts with primary sources, also known as internal sources. This is typically structured data gathered from CRM software, ERP systems, marketing automation tools, and others. These sources contain information about customers, finances, gaps in sales, and more.
Then comes secondary sources, also known as external sources. This is both structured and unstructured data that can be gathered from many places.
For example, if you’re looking to perform a sentiment analysis toward your brand, you could gather data from review sites or social media APIs.
 While it’s not required to gather data from secondary sources, it could add another element to your data analysis. This is becoming more common in the age of big data.
Data analysis step 3: Clean unnecessary data
Once data is collected from all the necessary sources, your data team will be tasked with cleaning and sorting through it. Data cleaning is extremely important during the data analysis process, simply because not all data is good data.
Data scientists must identify and purge duplicate data, anomalous data, and other inconsistencies that could skew the analysis to generate accurate results.
37.75%
of a data scientist’s time is spent on data preparation and cleansing rather than generating insights.
Source: Anaconda
With advances in data science and machine learning platforms, more intelligent automation can save a data analyst’s valuable time while cleaning data.
Data analysis step 4: Analyze data
One of the last steps in the data analysis process is analyzing and manipulating the data, which can be done in various ways.
One way is through data mining, which is defined as “knowledge discovery within databases”. Data mining techniques like clustering analysis, anomaly detection, association rule mining, and others could unveil hidden patterns in data that weren’t previously visible.
There’s also business intelligence and data visualization software, both of which are optimized for decision-makers and business users. These options generate easy-to-understand reports, dashboards, scorecards, and charts.
Data scientists may also apply predictive analytics, one of the four data analytics used today (descriptive, diagnostic, predictive, and prescriptive). Predictive analysis looks ahead to the future, attempting to forecast what will likely happen next with a business problem or question.
What are the types of data analysis methods?
Data analysis methods can be broadly classified into the following categories:
- Quantitative data analysis
- Qualitative data analysis
- Statistical analysis
- Textual analysis
- Descriptive analysis
- Predictive analysis
- Prescriptive analysis
- Diagnostic analysis
Data analysis step 5: Interpret the results
The final step is interpreting the results from the data analysis. This part is essential because it’s how a business will gain actual value from the previous four steps.
Interpreting data analysis results should validate why you conducted it, even if it’s not 100 percent conclusive. For example, “options A and B can be explored and tested to reduce production costs without sacrificing quality.”
Analysts and business users should look to collaborate during this process. Also, when interpreting results, consider any challenges or limitations that may not have been present in the data. This will only bolster your confidence in the next steps.
Why is data analysis so important?
From small businesses to global enterprises, the amount of data businesses generate today is simply staggering, and this is why the term “big data” has become so buzzwordy.
However, without proper data analysis, this mountain of data does little other than clog up cloud storage and databases.
Learn more about data analytics and implement it to uncover valuable insights within your systems.
Devin Pickell
Devin is a former senior content specialist at G2. Prior to G2, he helped scale early-stage startups out of Chicago's booming tech scene. Outside of work, he enjoys watching his beloved Cubs, playing baseball, and gaming. (he/him/his)

