


Data is everywhere.
But only a tiny percent of the data generated is analyzed and put to use.
Every search or click we make on the internet is indexed and used by businesses to understand our preferences better. If a company can capture and store its customer data, it can analyze this data and use the derived insights to make valuable decisions.
Did you search for "running shoes" online?
Online retailers will use your search information to serve personalized ads and entice you to buy a pair of running shoes from their stores.
Of course, the process of serving targeted ads might seem simple. Simple in the sense that when a customer searches for running shoes, they’re served running shoe advertisements.
But the thing is, you aren't the only person searching for a pair of running shoes at a given time, and there are hundreds of retailers waiting to do business with you. Since several other factors will affect your purchasing decision, including past purchase behavior, demographics such as age, and time of the year, retailers need to consider them as well.
At any given moment, the amount of customer data generated is massive. For humans, it's a Herculean task to make sense of such vast volumes of data. Although it's impossible to fully utilize the data generated, a lot can be achieved with the help of big data analytics tools.
What is big data analytics?
Big data analytics (BDA) is the process of analyzing large volumes of data to derive insights from it. These insights could be correlations, hidden patterns, market trends, customer preferences, or anything that could help organizations make better and informed business decisions.
Huge volumes of data that keep growing exponentially with time are called big data.
Big data is still data, but huge. It's large and complex to the extent that it can't be stored or processed using traditional data management systems or traditional business intelligence solutions; hence it requires big data analytics.
Big data analytics is an advanced form of data analytics. It includes complex applications powered by statistical algorithms, predictive models, and more. It can answer numerous advanced and lucrative business-related questions by examining large sets of structured and unstructured data.
Artificial intelligence, machine learning, and deep learning can accelerate the analysis part and help companies make sense of big data and gain more complex insights. Machine learning algorithms can help collect, analyze, and interpret big data. They can also be implemented in several big data operations, including data segmentation and labeling.
Data vs. information
Note that the terms "data" and "information" don't mean the same. Data on its own doesn't carry any special meaning. It's just a random collection of numbers and details. Data can be structured, unstructured, or semi-structured. When data is processed, structured, interpreted, and presented, it’s called information.
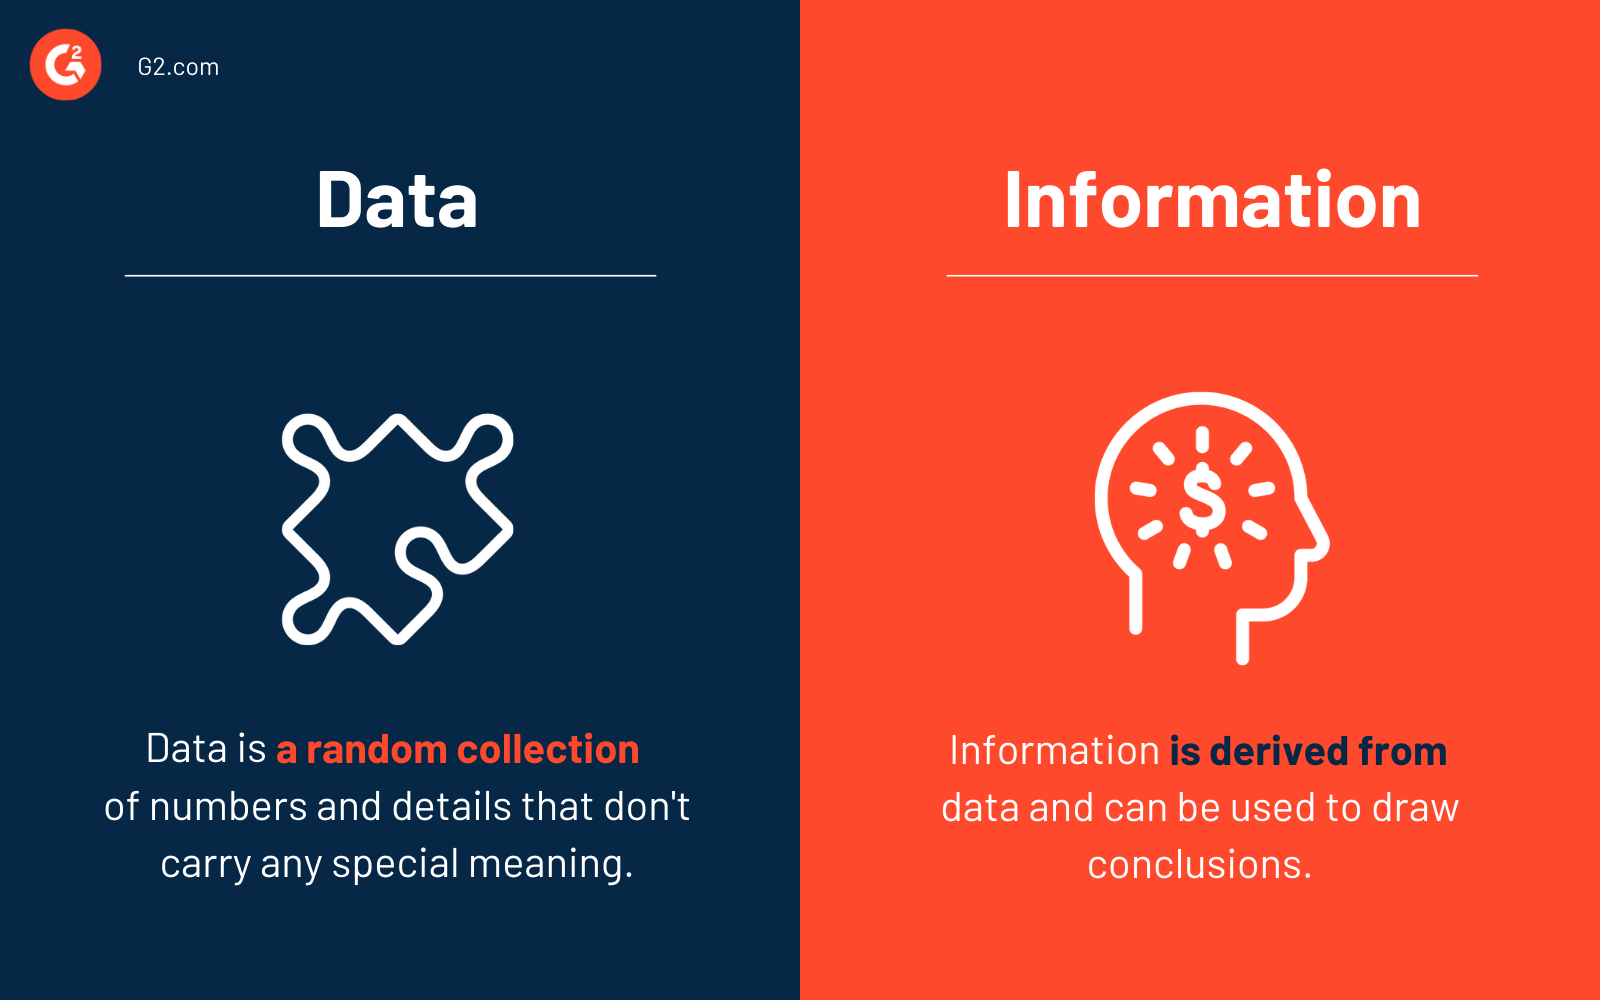
In other words, information is derived from data and can be used to draw conclusions. Data doesn't depend on the information, but the reverse isn't true. Information provides context to data and makes it meaningful and valuable.
For example, a list of dates (data) is meaningless. The information that it's the list of holidays gives relevance to the data.
Like data and information, many often confuse data analysis and data mining.
In essence, data mining uses mathematical and scientific models to identify trends and patterns in data. On the other hand, data analysis uses analytics models and business intelligence tools. Data mining is often considered to be the subset of data analysis.
Want to learn more about Big Data Analytics Software? Explore Big Data Analytics products.
Why is big data analytics important?
We live in a data-driven world.
The volume of data generated each year is increasing exponentially, and the numbers are already so huge that our brain will have a hard time comprehending them. For context, the volume of data expected to be generated in 2023 is nearly three times what was created in 2019.
Businesses can't afford to miss big data analytics. It's essential to gain a competitive advantage and predict upcoming market trends. More importantly, BDA enables firms to understand their customers better and find more ways to increase their lifetime value.
Big data technologies like Hadoop can help businesses reduce operational costs and find means to increase efficiency. They're faster and better than humans in decision-making and also understand the needs and wants of customers.
The traditional approach to data analytics takes place after an event happens. On the contrary, in big data analytics, the analysis can be historical or real-time, meaning data can be collected and processed almost instantaneously. This characteristic enables BDA to create several breakthroughs in healthcare, manufacturing, transportation, and e-commerce.
In short, big data analytics can help businesses:
- Find new revenue opportunities
- Forecast market trends and predict consumer behavior
- Create effective marketing campaigns
- Enhance customer personalization and experience
- Improve customer acquisition and retention strategies
- Find ways to improve processes and reduce costs
- Develop relevant products that customers will love
- Identify potential risks
Types of big data analytics
Data is the basic raw material for data science.
Not only do historical data act as evidence, but they also help data scientists craft stories. Such stories can help companies make impactful decisions that aren't based on instincts. In fact, BDA allows companies to rely on facts and not feelings.
There are four different types of big data analytics: descriptive, diagnostic, predictive, and prescriptive.
Not all analytics paint the same picture. They answer different questions relating to data and fuel different kinds of decision-making processes. In essence, all four types of big data analytics focus on extracting information from big data.
1. Descriptive analytics
Descriptive analytics answers the "what happened" question.
It's the most common and elementary form of data analytics, and in most cases, data scientists and analysts start their journey with descriptive analytics. It gives you an overview of what happened at a particular point in the past. In other words, it's the interpretation of historical data to understand the changes that have taken place in a business.
Descriptive analytics helps businesses understand how they're performing by offering context. Data visualization plays a crucial role in this type of big data analytics.
Descriptive analytics can help companies identify their strengths and weaknesses. Here are a few examples of how descriptive analytics can be used.
- Benchmarking annual sales and revenue of a business
- Calculating the average time taken by learners to finish a course
- Evaluating the return on investment (ROI) of a marketing campaign
Again, this type of big data analysis isn't primed to make any estimations. It's just used to crunch huge volumes of data into understandable chunks and understand what is happening.
2. Diagnostic analytics
Diagnostic analytics solves the "why did it happen" question.
It's a form of advanced analytics that can deliver valuable business insights and uncover the reasons behind specific results. It's generally performed with techniques such as drill-down, data mining, data discovery, and correlations. This type of analytics isn't capable of giving you any actionable insights.
Diagnostic analysis is also known as root cause analysis. It generally explores data to discover correlations. It helps determine what factors and events contributed to a particular outcome. For instance, in a time-series data of sales, diagnostic analytics can help you understand why sales increased or decreased in a specific month.
3. Predictive analytics
Predictive analytics answers the "what is likely to happen" question.
Simply put, predictive analytics can be compared to fortune-telling but without any speculations. It's at this point that big data analysis starts to get a bit complicated. With the help of AI and machine learning, predictive analytics can give organizations insights into what is likely to happen.
However, do note that this type of data analytics can't predict if an event will occur in the future. Instead, it just forecasts the probability of an event's occurrence.
Predictive analytics can be applied to identify customers who are likely to churn. This will allow businesses to take specific actions such as offering incentives to those customers.
4. Prescriptive analytics
Prescriptive analytics solves the "how to make it happen" question.
While predictive analytics offers the probability of an event's occurrence, prescriptive analytics goes a step further and suggests various actions to achieve a particular outcome. It also helps identify and avoid specific activities that can lead to problems in the future.
An example of prescriptive analytics is how Google Maps considers factors such as real-time traffic conditions, distance, and mode of transportation to come up with the fastest route.
Top big data analytics tools and technologies
A number of tools and technologies work together to make big data analytics feasible. They make data analytics more cost-effective and also make it easier to crunch terabytes (or petabytes) of data.
Here are some of the tools and technologies used in big data analytics:
- Apache Hadoop: It's an open-source software framework that can store and process big data sets. It offers enormous processing power and can handle large volumes of structured and unstructured data.
- Apache Spark: It's an open-source analytics engine used for processing big data. It uses data processing methods, including batch and stream processing.
- SQL: Stands for structured query language. It's one of the most commonly used languages for extracting data from databases.
- NoSQL databases: They are non-tabular or non-relational databases that store information in JSON documents, unlike relational databases that store information in rows and columns. They are ideal for raw and unstructured data and can handle large amounts of data.
- Data lake: It's a storage repository capable of storing massive volumes of raw data. It uses a flat architecture to save data.
- Data warehouse: It's a repository that stores business data collected from multiple sources. Data warehouses are designed to support business intelligence activities such as analytics and generally contain vast amounts of historical data.
How does big data analytics work?
Big data analytics is about deriving valuable insights from big data. This process of deriving insights is performed by analytics professionals such as data scientists and analysts. In short, big data analytics involves four major data preparation processes: collecting, processing, cleaning, and analyzing.
Before that, let's take a look at what data is big data. For that, you need to understand the three V's used to describe big data.
Three V’s of big data
Big data is data that's too huge for traditional data management systems to handle. But the term "big" is subjective. That's why it's described using three vectors: volume, velocity, and variety.
1. Volume
Volume is the V that's most associated with big data. Volume indicates the amount of data generated. This could be data generated from websites, smartphones, virtual assistants, smartwatches, basically from anything.
That's just one part of the equation. Data is generated by individual users when they like, comment, and share. In short, the data generated by such platforms is vast and can't be handled by traditional systems. This represents the volume aspect of big data.
2. Velocity
Velocity is the speed at which data is generated. It specifies the growth of data and profoundly impacts how we see data. It also affects the improvement of technologies employed to utilize data.
That's a colossal amount of data coming in each day. Another example is data generated by the Internet of Things (IoT) devices. With IoT taking most industries by storm, the data generated by devices such as sensors, security cameras, and wireless trackers is rapidly increasing.
3. Variety
When talking about data, many might have a mental image of rows and columns in excel sheets. A few decades ago, that picture was almost accurate. But now, we have a wide variety of data sets, including images, audio and video recordings, numbers, text, and sensor data.
Most of the data generated or collected are unstructured and don't really fit into spreadsheets. This also means that unlike in the past, the data generated won't neatly fit into a single database application. This diversity in big data is called variety.
A few decades ago, the volume, velocity, and variety of data overwhelmed the then available state-of-the-art, traditional systems. But now, a smartphone will have enough storage capacity and computational power to store and process that kind of data.
Four data preparation processes
Now back to how big data analytics work.
Analytics professionals such as data analysts and scientists, statisticians, and predictive modelers collect, process, clean, and analyze big data. Also, big data is often a mixture of structured and unstructured data.
1. Data collection
Data needs to be collected to be analyzed. The process of data collection will look different for different organizations and will also differ based on how they plan to use that data.
Some of the sources from which data is collected are:
- Web server logs
- Mobile apps
- IoT devices
- Social media activity
- In-store activity
Since big data is so "big" and diverse, storing this data in a database isn't always viable. Data scientists may have to rely on newer approaches like applying metadata and then loading it into a data lake.
Metadata: Data that describes other data. File name, type, and size are some examples of metadata.
Big data is rarely structured. It's a combination of structured, unstructured, and semi-structured data. Here's how they differ.
Structured data
Structured data is data that’s linear and stored in a relational database. Think of rows and columns of data you see on a spreadsheet. It's easy for big data applications to process structured data, but they account for only a tiny fraction of today's data.
Unstructured data
Not surprisingly, by 2022, nearly 80 percent of all data will be unstructured. Text messages, audio recordings, pictures, and videos are some examples. Unstructured data is diverse and sometimes even random. Compared to structured data, unstructured data is hard to make sense of, and big data applications will have difficulty processing it.
Semi-structured data
Data that can't be organized in a relational database but have some structural properties is called semi-structured data. Emails, zipped files, web pages, and TCP/IP packets are some examples. However, with some processes, semi-structured data can sometimes be stored in relational databases. An example of it would be XML data.
2. Data processing
After collecting and storing data, it needs to be processed and sorted for usage. The pace at which data grows makes it a challenging task to process big data. There are numerous types of data processing methods.
Batch processing
Batch processing is when massive volumes of data, stored over a period of time, are analyzed together or in batches. It's crucial when large data sets need to be processed for comprehensive insights. Since there's a large amount of data involved, the system will take hours, if not days, to process. However, by processing data in batches, computational resources are saved.
Distributed processing
Most big datasets are too large to be processed in a single machine. As the name suggests, distributed processing breaks down large data sets into smaller chunks and stores them across multiple servers. It has a high fault tolerance because if one server fails, the data processing tasks can be assigned to other available servers.
Stream processing
Stream processing refers to processing data as soon as it's produced or collected. Unlike batch processing, there’s a little-to-no delay from the time data is received and processed. Stream processing is ideal if real-time analytics is essential for your business. However, it can be more complex than batch processing and is generally expensive.
Real-time processing
Real-time processing is used when output is expected almost instantaneously. It processes incoming data as quickly as possible, and if it encounters an error, it’ll ignore it and proceed to the next block of incoming data. GPS-tracking apps are excellent examples of real-time data processing.
Additionally, there are other data processing types such as online processing, commercial data processing, and multiprocessing.
3. Data cleansing
Not all data collected is of good quality. And the insights derived from data are only as good as the data.
Simply put, low-quality data will give rise to low-quality insights. Data cleansing is performed to make sure the data used is of good quality or relevant to an organization's aspirations.
Also known as data scrubbing or cleaning, data cleansing is the process of cleaning up data. It's a critical part of big data analysis and can directly affect the quality of data-driven decision-making. It involves correcting or removing corrupt, incorrect, duplicate, or wrongly formatted data in a dataset.
Data scientists spend nearly 45 percent of their time loading and cleaning data. Since clean data is a critical component of accurate insights, the time spent is easily justified.
Data cleaning is critical when combining multiple data sources. That's because, in such instances, the chances of data being duplicated or mislabeled are higher.
Here are the seven properties of quality data:
- Accuracy
- Consistency
- Completeness
- Validity
- Relevance
- Uniformity
- Timeliness
The techniques used for data cleansing vary depending on the organization and the type of data it handles. Here are five basic steps involved in the cleaning process.
- Remove duplicate or irrelevant data observations
- Correct structural errors
- Remove outliers (a data point that significantly differs from other observations) if necessary
- Drop, input, or flag missing values
- Analyze data quality
Artificial intelligence and machine learning play crucial roles in cleaning unstructured forms of data like images, audio recordings, and videos. Additionally, natural language processing can be used to clean human-generated text-heavy data by a process called text mining.
4. Data analysis
Once the data is collected, stored, processed, and cleansed for quality, it's ready to be analyzed. This final step is called data analysis and, in essence, is the extraction of valuable information from massive volumes of data.
As mentioned before, there are four different types of big data analytics: descriptive, diagnostic, predictive, and prescriptive. And again, not all kinds of analytics show the same picture.
Big data analytics applications
Where there's data, there's scope for analytics.
If you're hooked to the internet, chances are pretty high that you constantly use features that are made possible by big data and analytics. Amazon's and YouTube's recommendation systems are quick examples.
Here are some real-world use cases of big data analytics:
- Customer experience: Big data analytics makes it possible to elevate customer experience by analyzing customer information such as previous purchases, preferences, and buying behaviors. Businesses can better understand the needs and wants of their customers and tailor their offerings accordingly.
- Product development: Creating products that customers will love to use is crucial. Big data analytics can help companies by offering insights around development decisions, product viability, and progress analysis.
- Fraud detection: Using predictive analytics, businesses can detect anomalies in customer behavior and prevent fraudulent activities. Preventing credit card fraud is an example. Fraud detection is made possible by analyzing a customer's purchase information such as time and place of purchase and watching out for anomalies.
- Customer retention: Customer satisfaction is a critical aspect of customer retention. By giving customers what they want, customers are more likely to stay loyal to a business. Big data platforms can help companies with this task. An example of this is the recommendation engines of YouTube and Netflix that keep users hooked to the respective services.
- Supply chain management: Big data analytics plays an instrumental role in supply chain management. It enables stakeholders to forecast upcoming demand and optimize inventory accordingly. Along with inventory management, it also helps companies reduce transportation costs with route optimization.
Challenges of big data analytics
Although big data analytics brings several benefits to a business, its implementation isn't always straightforward. Companies must adopt a data-driven culture and have the necessary tools to collect, process, and analyze data. Here are some challenges organizations might face while adopting big data analytics.
Quality of data
In big data analytics, quality data is everything. Low-quality, duplicate, or inconsistent data sets can lead to many problems, including misinterpretation, poor decision-making, and ultimately loss of revenue. Low-quality data can also create involuntary bias in a system.
Of course, big data can't be 100% accurate. And it doesn't have to be entirely accurate to be useful. But extremely low-quality data sets will do more harm than good and won't bring any valuable insight. Duplicate data can also cause contradictions and can spoil your efforts in making decisions that require utmost accuracy.
Synchronization of data sources
Data is collected from a variety of sources, including social media platforms and company websites. Businesses can also collect data from customers if they use in-store facilities such as Wi-Fi. Retailers such as Walmart are known to couple in-store surveillance with computer vision technology to identify the aisles customers visit the most and the least.
Most businesses are growing at a rapid pace. This also means that the amount of data generated by them is also increasing. Although the data storage part is sorted for a decade or more, thanks to data lakes and data warehouses, synchronizing data across different data sources can be challenging.
This process of combining data from different sources into a unified view is called data integration and is crucial for deriving valuable insights. Unfortunately, this is one aspect of big data analytics that many companies overlook, leading to logic conflicts and incomplete or inaccurate results.
Organizational resistance
Apart from some of the technological aspects of big data analytics, adopting a data-driven culture in an organization can be challenging. In a 2021 NewVantage Partners Big Data and AI Executive Survey, it was revealed that only 24.4% of the companies that participated had forged a data culture within their firms.
Lack of understanding, lack of middle management adoption, business resistance, and insufficient organizational alignment are some of the reasons why companies are yet to adopt a data-driven culture.
Other challenges
Lack of talent is a significant challenge companies face while integrating big data. Although the number of individuals opting for a career in data science and analytics is steadily increasing, there's still a skill shortage.
Data quality maintenance is another issue. Since data comes from multiple sources at high velocity, the time and resources required to properly manage data quality can be significant.
Top 5 big data analytics software solutions
Big data analytics software solutions make it possible to crunch large amounts of data and derive insights from them. These tools help detect trends and patterns in large data sets and can also help with data visualization.
To qualify for inclusion in the big data analytics category, a product must:
- Process data
- Query file systems
- Connect to big data clusters
- Allow users to transform big data sets into useful and understandable data visualizations
- Create reports, visualizations, and dashboards based on the insights derived from the data sets
* Below are the five leading big data analytics software from G2's Spring 2021 Grid® Report. Some reviews may be edited for clarity.
1. Qlik Sense
Qlik Sense is an analytics platform that offers self-service analytics ideal for all types of users across an organization. It helps build a data-literate workforce and offers robust data integration and open APIs.
What users like:
"It's quick and easy to stand up an application in Qlik Sense, and there are several interactive ways to share widgets with my team. It also allows my team to edit and create visualizations of their own."
- Qlik Sense Review, Dan B.
What users dislike:
"I've been working with Qlik for a long time now, so coming from Qlikview, I sometimes find myself wanting to do things Qlik Sense can't do naturally. You will need third-party extensions to achieve requirements that Qlikview could do with ease. This is becoming less of a problem with every new version of Qlik Sense, though."
- Qlik Sense Review, Severino H.
2. Azure Databricks
Azure Databricks is a collaborative Apache Spark-based analytics service that can unlock insights from big data and help build AI solutions. Its integration with Azure Machine Learning makes it easier to identify suitable algorithms and access advanced machine learning capabilities.
What users like:
"The versatility of Databricks allows it to be used by engineers and data scientists alike. With continual integration and updates from Azure, Databricks is constantly evolving and growing into a robust mechanism for processing large data. With a few spark commands, it can quickly process data in any business."
- Azure Databricks Review, Ben B.
What users dislike:
"When using Azure Databricks, I've found that I need some hands-on help to get the gist of how it works. It can take a while to learn what all of the features do and to explore everything this fantastic Big Data Analytics tool has to offer."
- Azure Databricks Review, Anudeep Sri B.
3. MATLAB
MATLAB is a high-performing programming and computing platform used to analyze data and develop algorithms. It offers an easy-to-use environment in which problems and solutions are represented in mathematical notations.
What users like:
"It's straightforward for programming, like C. Many resources are available at a click in the software itself. The main advantage is that it has many toolboxes for almost every field. The way of importing data is effortless and intuitive. Graph customization is beneficial for research and academics. Data can be imported, analyzed, and visualized in high-resolution graphs and images. I like the image processing and signal processing capabilities of MATLAB. Also, cutting-edge technologies such as AI, deep learning, machine learning, hardware interfacing controlling various instruments, etc., are available in MATLAB."
- MATLAB Review, Dipak K.
What users dislike:
"Integrals, derivatives, and other operations with implicit functions take longer than other programming languages. This is a minor problem that you can always find workarounds, though."
- MATLAB Review, Lucas M.
4. Qubole
Qubole is a secure data lake platform ideal for machine learning, streaming, and ad-hoc analytics. Using this platform, companies can connect and explore data from multiple relational and non-traditional databases.
What users like:
"Qubole is astonishingly easy to use. We were able to implement our Big Data workloads very quickly. We got great support from them during the implementation. We are continuing to get great help with our new projects and existing implementations. It's scaled with our increased needs for processing. The most significant advantage is that it has reduced our cloud computing costs."
- Qubole Review, Christian U.
What users dislike:
"The continuous need to update services or request support for simpler things - don't get me wrong, the requirements are taken care of - just the smaller things need some finesse."
- Qubole Review, Achilles S.
5. Google BigQuery
Google BigQuery is a serverless, low-cost enterprise data warehouse used for analytics. It's beneficial to securely access and share insights across an organization and can also help create reports and dashboards.
What users like:
"Having the ability to store and query from enormous datasets without worrying so much about infrastructure is fantastic. I have databases with trillions of data points in them. Without BigQuery, I would need to constantly upgrade the hardware to store/retrieve the data I need. With BigQuery, I only have to worry about making the query optimized to handle the load. The queries are also extremely fast as well as saveable so that you can rerun things easily. The web interface and command-line utility are very well documented and easy to use."
- Google BigQuery Review, Nick B.
What users dislike:
"I've not run across too many issues. As this is cloud-based, moving large data sets from/to our internal servers can be somewhat sluggish, but this is not an issue connected to BigQuery. As a relatively new user, I have been quite happy with it so far."
- Google BigQuery Review, Joel M.
Data is the new oil
Although many might argue that it isn't, data is the new oil and it fuels decision-making processes in almost every industry. The good news is that it's abundant and is growing exponentially. Big data analytics is that combustion engine that uses data as its fuel to drive innovation.
The big data analytics market is forecasted to reach $103 billion by 2023. Of course, we've uncovered only the tip of the "big data iceberg". With computational power and storage becoming cheaper, more companies can now use big data analytics to make better decisions.
Big data makes artificial intelligence feasible. The level of artificial intelligence we currently have is called narrow AI. Although it might sound weak, it's behind several innovations, including self-driving cars and voice assistants.

Amal Joby
Amal is a Research Analyst at G2 researching the cybersecurity, blockchain, and machine learning space. He's fascinated by the human mind and hopes to decipher it in its entirety one day. In his free time, you can find him reading books, obsessing over sci-fi movies, or fighting the urge to have a slice of pizza.

