Best Predictive Analytics Tools and Software

How Many Predictive Analytics Software Products Does G2 Track?

Total Products under this Category: 421

Category Stats (Sep 2026)

  • Average Rating: 4.45/5 (↑0.01 vs Aug 2026) The average rating of products in this category, based on all submitted ratings
  • Top Trending Product: Palantir Foundry (+1.8%) - Among all products in this category, Palantir Foundry recorded the largest rating increase compared to last month

Last updated: September 15, 2026

How Does G2 Rank Predictive Analytics Software Products?

Why You Can Trust G2's Software Rankings:

  • 30 Analysts and Data Experts
  • 30,000+ Authentic Reviews
  • 421+ Products
  • Unbiased Rankings

G2's software rankings are built on verified user reviews, rigorous moderation, and a consistent research methodology maintained by a team of analysts and data experts. Each product is measured using the same transparent criteria, with no paid placement or vendor influence. While reviews reflect real user experiences, which can be subjective, they offer valuable insight into how software performs in the hands of professionals. Together, these inputs power the G2 Score, a standardized way to compare tools within every category.

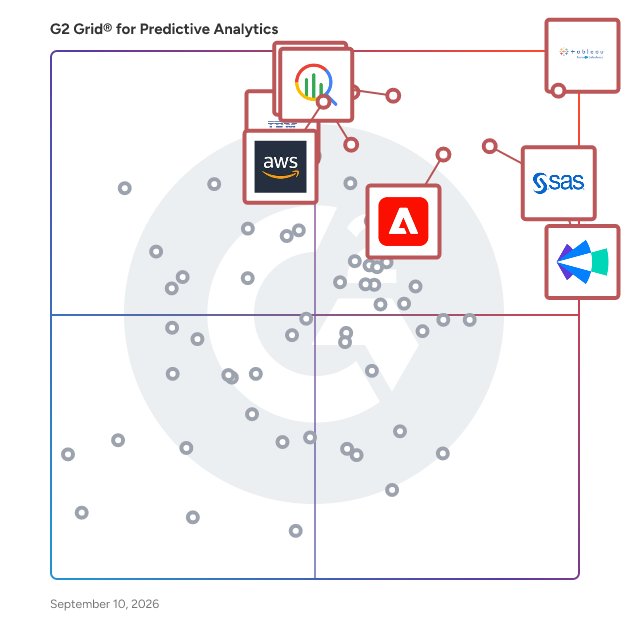
G2 Grid® for Predictive Analytics Software

G2 Grid® for Predictive Analytics Software plotting products by satisfaction and market presence

Highlighted products: Tableau, Clari, SAS Viya, Google Cloud BigQuery, Adobe Analytics, IBM Cognos Analytics, Amazon Quick, and IBM SPSS Statistics.

Underlying data: [Grid® JSON](https://www.g2.com/categories/predictive-analytics/grids.json?focus%5B%5D=tableau&focus%5B%5D=clari&focus%5B%5D=sas-sas-viya&focus%5B%5D=google-cloud-bigquery&focus%5B%5D=adobe-analytics&focus%5B%5D=ibm-cognos-analytics&focus%5B%5D=amazon-quick&focus%5B%5D=ibm-spss-statistics)

Tableau

Tableau is the world’s leading AI-powered analytics platform. Whether you are a business user or an analyst, Tableau turns trusted data into actionable insights. With our flexible, interoperable platform, you can: Turn data into action at scale with human and agent collaboration. Tableau Next delivers agentic AI for faster data-insight-action workflows. It surfaces insights, provides proactive recommendations, and helps you take action in the flow of work. Scale data-driven insights with complete operational confidence. Tableau Cloud enables fully managed analytics at scale. It accelerates your time to value and gives you access to the latest AI-powered innovations. Deploy visual, self-service analytics with unmatched control and flexibility. Tableau Server meets your organization's governance and security needs. It provides enterprise-grade, self-service analytics on-premise or in your private cloud.

Average Rating: 4.4/5.0

Total Reviews: 3,731

How Do G2 Users Rate Tableau?

  • Has the product been a good partner in doing business?: 8.6/10 (Category avg: 8.9/10)
  • AI Text Summarization: 8.0/10 (Category avg: 8.1/10)
  • Algorithms: 8.4/10 (Category avg: 8.6/10)
  • AI Text Generation: 8.0/10 (Category avg: 8.1/10)

Who Is the Company Behind Tableau?

  • Seller: Salesforce
  • Company Website:
  • Year Founded: 1999
  • HQ Location: San Francisco, CA
  • Twitter: @salesforce
    579,511 Twitter followers
  • LinkedIn® Page: www.linkedin.com
    89,711 employees on LinkedIn®

Who Uses This Product?

  • Who Uses This: Data Analyst, Business Analyst
  • Top Industries: Information Technology and Services, Computer Software
  • Company Size: 41% Large, 36% Medium

What Do G2 Reviewers Say About Tableau?

AI-generated summary from verified user reviews

Pros
  • Users highlight the ease of use of Tableau, simplifying data visualization and integration for effective decision-making.
  • Users value the ease of creating interactive visualizations with Tableau, simplifying data analysis from multiple sources.
  • Users love the intuitive and powerful visualization capabilities of Tableau, enabling clear insights from complex data.
  • Users appreciate the ease of use and powerful visualization features of Tableau, streamlining data presentation and analysis.
  • Users find Tableau's intuitive design exceptional, enabling effortless data visualization and interactive dashboards for effective reporting.
Cons
  • Users find the learning curve steep, complicating the onboarding process and integration with Salesforce.
  • Users find learning Tableau challenging, particularly due to its complexity and difficulties in collaboration and calculations.
  • Users find Tableau expensive, with costs complicating its value in large organizations and advanced functionalities.
  • Users experience slow performance with large datasets and lengthy data refresh processes, leading to frustration.
  • Users find Tableau's onboarding complex, making simple tasks unnecessarily complicated and challenging to switch from MS products.

What Are Recent G2 Reviews of Tableau?

What Are G2 Users Discussing About Tableau?

Clari

Clari+Salesloft is a category-transforming AI company architecting the future of revenue. By building the world’s first Predictive Revenue System, we help organizations move beyond fragmented applications and systems of record to a model that continuously drives and adapts revenue execution. Our platform captures deal data signals, and uses tailor-built AI to create the right context and drive action across sales teams. Instead of disconnected insights and siloed workflows, sales teams operate with shared understanding, faster decisions, and execution that stays aligned to the business. Trusted by thousands of enterprises including Adobe, 3M, IBM, and Zoom, Clari+Salesloft powers the forecast, surfaces pipeline risk, and drives proactive execution—returning thousands of hours to the field and enabling predictable, scalable growth.

Average Rating: 4.6/5.0

Total Reviews: 5,519

How Do G2 Users Rate Clari?

  • Has the product been a good partner in doing business?: 9.2/10 (Category avg: 8.9/10)
  • Algorithms: 10.0/10 (Category avg: 8.6/10)

Who Is the Company Behind Clari?

  • Seller: Salesloft
  • Year Founded: 2011
  • HQ Location: Atlanta, GA
  • Twitter: @Salesloft
    18,437 Twitter followers
  • LinkedIn® Page: www.linkedin.com
    1,098 employees on LinkedIn®

Who Uses This Product?

  • Who Uses This: Account Executive, Account Manager
  • Top Industries: Computer Software, Information Technology and Services
  • Company Size: 47% Medium, 41% Large

What Do G2 Reviewers Say About Clari?

AI-generated summary from verified user reviews

Pros
  • Users love the ease of use of Clari, noting its intuitive interface and seamless forecasting capabilities.
  • Users value the ease of use in Clari's forecasting, allowing seamless updates and tracking of quotas.
  • Users value Clari's seamless Salesforce integration and real-time updates, enhancing sales focus and workflow efficiency.
  • Users value the Salesforce integration in Clari, enabling efficient access to comprehensive account-level data.
  • Clari's user-friendly admin features simplify management and forecasting, enhancing our ability to plan and execute effectively.
Cons
  • Users face customization limitations with Clari, finding it challenging to tailor the product to unique business needs.
  • Users find limited customization options in Clari hinder their ability to tailor it to specific business needs.
  • Users find the learning curve challenging due to upfront configuration and occasional UI confusion, despite its ease of use.
  • Users find missing features in Clari, particularly with filtering options and limited customization for Salesforce integration.
  • Users experience inconsistencies in Salesforce integration that can lead to confusion and hinder effective decision-making.

What Are Recent G2 Reviews of Clari?

What Are G2 Users Discussing About Clari?

SAS Viya

SAS Viya is a cloud-native data and AI platform that enables teams to build, deploy and scale explainable AI that drives trusted, confident decisions. It unites the entire data and AI life cycle and empowers teams to innovate quickly while balancing speed, automation and governance by design. Viya unifies data management, advanced analytics and decisioning in a single platform, so organizations can move from experimentation to production with confidence, delivering measurable business impact that is secure, explainable and scalable across any environment. Key capabilities required to deliver trusted decisions include: • End-to-end clarity across the data and AI life cycle, with built-in lineage, auditability and continuous monitoring to support defensible decisions. • Governance by design, enabling consistent oversight across data, models and decisions to reduce risk and accelerate adoption. • Explainable AI at scale, so insights and outcomes can be understood, validated and trusted by business and regulators alike. • Operationalized analytics, ensuring value continues beyond deployment through monitoring, retraining and life cycle management. • Flexible, cloud-native deployment, allowing organizations to start anywhere and scale everywhere while maintaining control.

Average Rating: 4.3/5.0

Total Reviews: 775

How Do G2 Users Rate SAS Viya?

  • Has the product been a good partner in doing business?: 8.2/10 (Category avg: 8.9/10)
  • AI Text Summarization: 6.7/10 (Category avg: 8.1/10)
  • Algorithms: 8.6/10 (Category avg: 8.6/10)
  • AI Text Generation: 6.3/10 (Category avg: 8.1/10)

Who Is the Company Behind SAS Viya?

  • Seller: SAS Institute Inc.
  • Company Website:
  • Year Founded: 1976
  • HQ Location: Cary, NC
  • Twitter: @SASsoftware
    60,863 Twitter followers
  • LinkedIn® Page: www.linkedin.com
    15,122 employees on LinkedIn®

Who Uses This Product?

  • Who Uses This: Student, Biostatistician
  • Top Industries: Pharmaceuticals, Banking
  • Company Size: 33% Small, 33% Large

What Do G2 Reviewers Say About SAS Viya?

AI-generated summary from verified user reviews

Pros
  • Users value the ease of use in SAS Viya, enhancing data visualization and decision-making for businesses.
  • Users appreciate the advanced analytical capabilities of SAS Viya, making data analysis and decision-making more efficient.
  • Users value the sophisticated analytical capabilities of SAS Viya, enhancing decision-making and insights from diverse data sources.
  • Users value the end-to-end data lifecycle tooling in SAS Viya, enhancing insights and strategic decision-making capabilities.
  • Users value the powerful data visualization capabilities of SAS Viya, enhancing insights and decision-making in their organizations.
Cons
  • Users find SAS Viya difficult for non-technical users to navigate, impacting ease of access to reports and dashboards.
  • Users find the visualization complexity of SAS Viya challenging, especially for those without technical expertise.
  • Users find the learning curve challenging, especially for non-technical individuals navigating reports and dashboards.
  • Users find the difficult learning curve for SAS Viya challenging, especially for non-technical users attempting to access features.
  • Users find the expensive pricing of SAS Viya a potential barrier, complicating their decision-making process.

What Are Recent G2 Reviews of SAS Viya?

What Are G2 Users Discussing About SAS Viya?

Google Cloud BigQuery

BigQuery is an AI-ready, petabyte-scale, and cost-effective data warehouse that lets you run analytics over vast amounts of data in near real time. Store 10 GiB of data and run up to 1 TiB of queries for free per month.

Average Rating: 4.5/5.0

Total Reviews: 1,144

How Do G2 Users Rate Google Cloud BigQuery?

  • Has the product been a good partner in doing business?: 8.6/10 (Category avg: 8.9/10)
  • AI Text Summarization: 7.6/10 (Category avg: 8.1/10)
  • Algorithms: 8.8/10 (Category avg: 8.6/10)
  • AI Text Generation: 7.4/10 (Category avg: 8.1/10)

Who Is the Company Behind Google Cloud BigQuery?

  • Seller: Google
  • Year Founded: 1998
  • HQ Location: Mountain View, CA
  • Twitter: @google
    31,899,995 Twitter followers
  • LinkedIn® Page: www.linkedin.com
    301,144 employees on LinkedIn®
  • Ownership: NASDAQ:GOOG

Who Uses This Product?

  • Who Uses This: Data Engineer, Data Analyst
  • Top Industries: Information Technology and Services, Computer Software
  • Company Size: 38% Large, 35% Medium

What Do G2 Reviewers Say About Google Cloud BigQuery?

AI-generated summary from verified user reviews

Pros
  • Users value the ease of use of Google Cloud BigQuery, enabling fast analysis without needing to manage infrastructure.
  • Users appreciate the incredible speed of BigQuery, making data processing effortless and efficient for large datasets.
  • Users value the seamless integrations of Google Cloud BigQuery, enhancing analytics and supporting various data types effortlessly.
  • Users appreciate the fast querying capabilities of Google Cloud BigQuery, enabling quick analysis of massive datasets effortlessly.
  • Users value the query efficiency of BigQuery, enabling fast analysis of massive datasets with minimal effort.
Cons
  • Users find the cost structure expensive, especially with complex queries leading to rapidly escalating charges.
  • Users often face query issues with BigQuery, as inefficient queries can rapidly increase costs and complicate budgeting.
  • Users find the cost management challenging, facing unpredictable pricing and needing strict governance to maintain budgets.
  • Users face cost issues with Google Cloud BigQuery, often leading to unexpectedly high bills and budget management challenges.
  • Users find the steep learning curve for advanced features challenging, requiring significant time and effort to master.

What Are Recent G2 Reviews of Google Cloud BigQuery?

What Are G2 Users Discussing About Google Cloud BigQuery?

Adobe Analytics

Adobe Analytics empowers marketing, product, and business teams with insights to understand their customers and the journeys they take across digital channels, products, content, and services. From digital data collection and relational clickstream processing to in-depth analysis, and reporting, Adobe Analytics helps you understand visitor engagement across your digital properties — making it possible to optimize digital marketing strategies, improve user experience, and drive business growth. Features: - Collect and ingest behavioral data in real-time from your web and mobile channels. - Automatically convert raw data for unlimited analysis to discover customer patterns, spot anomalies, identify friction in your digital experiences, and uncover insights from digital journeys. - Equip marketers and analysts with AI capabilities that speed through analyses so they can quickly and confidently generate insights to improve the digital experience. - Integrate and share insights, segments, and outputs from your data across other business applications.

Average Rating: 4.2/5.0

Total Reviews: 1,174

How Do G2 Users Rate Adobe Analytics?

  • Has the product been a good partner in doing business?: 8.0/10 (Category avg: 8.9/10)
  • AI Text Summarization: 9.1/10 (Category avg: 8.1/10)
  • Algorithms: 8.6/10 (Category avg: 8.6/10)
  • AI Text Generation: 8.8/10 (Category avg: 8.1/10)

Who Is the Company Behind Adobe Analytics?

  • Seller: Adobe
  • Company Website:
  • Year Founded: 1982
  • HQ Location: San Jose, CA
  • Twitter: @Adobe
    956,842 Twitter followers
  • LinkedIn® Page: www.linkedin.com
    42,975 employees on LinkedIn®

Who Uses This Product?

  • Who Uses This: Data Analyst, Analyst
  • Top Industries: Marketing and Advertising, Information Technology and Services
  • Company Size: 43% Large, 30% Medium

What Do G2 Reviewers Say About Adobe Analytics?

AI-generated summary from verified user reviews

Pros
  • Users value the advanced segmentation and customizable dashboards of Adobe Analytics, enhancing data analysis and visualization.
  • Users value the advanced segmentation and customizable dashboards of Adobe Analytics for insightful data analysis and visualization.
  • Users value the ease of use in Adobe Analytics, making complex data analysis and integration straightforward and efficient.
  • Users value Adobe Analytics for its advanced data analysis and predictive reporting, enhancing decision-making and understanding user behavior.
  • Users value the advanced reporting features of Adobe Analytics, enabling informed and effective data-driven decision-making.
Cons
  • Users find the learning curve steep, requiring extensive training and support to effectively utilize Adobe Analytics.
  • Users find Adobe Analytics has a steep learning curve, requiring significant training to master its capabilities effectively.
  • Users find Adobe Analytics to be expensive, limiting accessibility for small teams with tight budgets.
  • Users experience slow performance with Adobe Analytics, facing delays and sluggishness, particularly with large datasets and reports.
  • Users find Adobe Analytics to have a steep learning curve that complicates setup and daily analysis tasks.

What Are Recent G2 Reviews of Adobe Analytics?

What Are G2 Users Discussing About Adobe Analytics?

IBM Cognos Analytics

IBM Cognos Analytics is a business intelligence and analytics solution that uses agentic AI to help teams transform trusted data into actionable insights, build governed analytical applications, and make better decisions. Teams can explore data, monitor KPIs, analyze performance, forecast trends, and share insights across the business. The solution is built for business leaders, analysts, report authors, IT teams, and data governance teams that need governed reporting, self-service analytics, data modeling, and flexible deployment options. Common use cases include enterprise reporting, operational reporting, financial reporting, dashboarding, performance management, forecasting, and governed self-service analytics. It supports both centralized BI teams and distributed users who need consistent access to trusted analytics. Key capabilities: 1. Create governed reports and dashboards: Build, schedule, distribute, and manage reports, dashboards, and visualizations for teams, executives, and stakeholders. Support routine reporting, business reviews, and purpose-built analytical applications with consistent information. 2. Explore data with control: Use self-service analytics, certified data models, governed metrics, access controls, and auditability to keep reporting consistent across teams and departments. 3. Analyze and forecast faster: Use natural-language assistance, automated insights, and forecasting to help users understand data faster in supported versions and deployments. 4. Put Reporting Agents to work: Use agentic AI capabilities in supported versions and deployments to find reports, summarize results, share insights, and create or refine reports using natural language. 5. Deploy where the business needs it: Run Cognos Analytics in on-premises, IBM-hosted, hybrid, or certified container environments to align with infrastructure, security, and governance requirements. Cognos Analytics helps organizations reduce repetitive reporting work, improve consistency across metrics and dashboards, and make governed data analytics easier to access across the business.

Average Rating: 4.1/5.0

Total Reviews: 437

How Do G2 Users Rate IBM Cognos Analytics?

  • Has the product been a good partner in doing business?: 7.8/10 (Category avg: 8.9/10)
  • AI Text Summarization: 8.0/10 (Category avg: 8.1/10)
  • Algorithms: 8.6/10 (Category avg: 8.6/10)
  • AI Text Generation: 7.9/10 (Category avg: 8.1/10)

Who Is the Company Behind IBM Cognos Analytics?

  • Seller: IBM
  • Company Website:
  • Year Founded: 1911
  • HQ Location: Armonk, New York, United States
  • Twitter: @IBMSecurity
    74,660 Twitter followers
  • LinkedIn® Page: www.linkedin.com
    344,328 employees on LinkedIn®

Who Uses This Product?

  • Who Uses This: Software Engineer, Analyst
  • Top Industries: Information Technology and Services, Financial Services
  • Company Size: 58% Large, 26% Medium

What Do G2 Reviewers Say About IBM Cognos Analytics?

AI-generated summary from verified user reviews

Pros
  • Users appreciate the ease of use of IBM Cognos Analytics, facilitating quick data analysis and visualization.
  • Users appreciate the data visualization capabilities of IBM Cognos Analytics, enhancing understanding and insights effortlessly.
  • Users value the intuitive user interface of IBM Cognos Analytics, enhancing data comprehension and report creation efforts.
  • Users value the dashboard customization in Cognos Analytics, making complex data visuals clear and understandable.
  • Users appreciate the efficiency of IBM Cognos Analytics, benefiting from quick report generation and clear visualizations.
Cons
  • Users find the learning curve steep, requiring significant time and training to effectively utilize IBM Cognos Analytics.
  • Users find the pricing of IBM Cognos Analytics to be expensive, impacting overall satisfaction despite its features.
  • Users find IBM Cognos Analytics complex to navigate and build reports, often requiring extensive training for effective use.
  • Users find the complex usage of IBM Cognos Analytics challenging, especially with report creation and software integration.
  • Users find the learning difficulty of IBM Cognos Analytics challenging, especially for novices trying to build reports.

What Are Recent G2 Reviews of IBM Cognos Analytics?

What Are G2 Users Discussing About IBM Cognos Analytics?

Amazon Quick

Amazon QuickSight is a cloud-based unified business intelligence (BI) service at hyperscale. With QuickSight, all users can meet varying analytic needs from the same source of truth through modern interactive dashboards, paginated reports, natural language queries and embedded analytics. With Amazon Q in QuickSight, business analysts and business users can use natural language to build, discover, and share meaningful insights in seconds, turning insights into impact faster. Over 100,000 customers use Amazon QuickSight. Learn more at https://quicksight.aws

Average Rating: 4.3/5.0

Total Reviews: 677

How Do G2 Users Rate Amazon Quick?

  • Has the product been a good partner in doing business?: 8.3/10 (Category avg: 8.9/10)
  • AI Text Summarization: 8.2/10 (Category avg: 8.1/10)
  • Algorithms: 8.1/10 (Category avg: 8.6/10)
  • AI Text Generation: 8.2/10 (Category avg: 8.1/10)

Who Is the Company Behind Amazon Quick?

  • Seller: Amazon Web Services (AWS)
  • Year Founded: 2006
  • HQ Location: Seattle, WA
  • Twitter: @awscloud
    2,232,483 Twitter followers
  • LinkedIn® Page: www.linkedin.com
    147,094 employees on LinkedIn®
  • Ownership: NASDAQ: AMZN

Who Uses This Product?

  • Who Uses This: Data Analyst, Software Engineer
  • Top Industries: Computer Software, Information Technology and Services
  • Company Size: 40% Small, 36% Medium

What Do G2 Reviewers Say About Amazon Quick?

AI-generated summary from verified user reviews

Pros
  • Users appreciate the s seamless integration of Amazon QuickSight with AWS services for effective dashboard creation.
  • Users value the ease of use of Amazon QuickSight, simplifying the creation of interactive dashboards effortlessly.
  • Users highlight the manual integration ease of Amazon QuickSight, streamlining data collection and workflow seamlessly with AWS.
  • Users value the fast and intuitive data visualization features of Amazon QuickSight, enhancing analytical capabilities effortlessly.
  • Users value the intuitive dashboard creation in Amazon QuickSight, enhancing data accessibility and team collaboration.
Cons
  • Users find limited customization in Amazon QuickSight, impacting advanced analytics and visual flexibility compared to competitors.
  • Users find the learning curve challenging, requiring prior knowledge for effective use of QuickSight's features.
  • Users note the limited visualization options in Amazon QuickSight, impacting flexibility and usability for data presentations.
  • Users note the missing features in QuickSight, especially in customization and advanced visual options compared to competitors.
  • Users find the poor interface design of Amazon QuickSight hinders usability and complicates access to advanced features.

What Are Recent G2 Reviews of Amazon Quick?

What Are G2 Users Discussing About Amazon Quick?

IBM SPSS Statistics

IBM SPSS Statistics is an end-to-end statistical solution that simplifies advanced statistical analysis across industries for users of any statistical expertise. It offers comprehensive resources, expert support, and proven reliability to transform complex data into impactful decisions IBM SPSS Statistics recent version 32 release comes up with powerful new features such as AI Output Assistant, Mediation Analysis, Curated Help Designer and many advanced algorithms. IBM SPSS Statistics • offers an easy to use drag and drop interface along with AI Output Assistant to interpret complex statistical output in easy language. • simplifies complex data analysis using advanced statistical techniques that performs data preparation and management, to analysis and reporting. • performs predictive analysis using advanced forecasting procedures to uncover patterns and predict future trends. • creates compelling visual representations to identify trends, derive accurate conclusions and deliver graphs and presentation-ready reports Explore how both individuals and organizations spanning across Industries can simply complex statistical test through an easy to use, accurate ,reliable and secure solution. Use Cases 1. Market Research - Statistical procedures highlighting how to do market research with IBM SPSS 2. Client Acquisition – Emphasizes on how can organizations can acquire more clients and understand consumer behavior 3. Forecasting – Analyze historical sales data, evaluate key trends, predict outcomes relevant to inventory planning 4. Healthcare - Enabling healthcare organizations to improve patient outcomes 5. Government - Empowering Government institutions to take smarter policy decisions 6. Supply Chain - Utilize Statistical Algorithms to make data-driven decisions across procurement, inventory, logistics, and demand planning. Visit here to see what's new in v32 - https://www.ibm.com/products/spss-statistics/whats-new

Average Rating: 4.2/5.0

Total Reviews: 889

G2 Deal: Turn complex data into reliable insights. Get 30% off your first monthly or annual subscriptions. Offer ends 15 April 2026.

Analyze data, forecast trends faster now with AI that interprets results. With IBM SPSS Statistics, you get 30% off your first monthly subscriptions. Offer ends 15 April 2026.

Price: ~~79.00 USD~~ → 55.30 USD

View this exclusive G2 deal

How Do G2 Users Rate IBM SPSS Statistics?

  • Has the product been a good partner in doing business?: 8.0/10 (Category avg: 8.9/10)
  • AI Text Summarization: 10.0/10 (Category avg: 8.1/10)
  • Algorithms: 7.7/10 (Category avg: 8.6/10)
  • AI Text Generation: 10.0/10 (Category avg: 8.1/10)

Who Is the Company Behind IBM SPSS Statistics?

  • Seller: IBM
  • Company Website:
  • Year Founded: 1911
  • HQ Location: Armonk, New York, United States
  • Twitter: @IBMSecurity
    74,660 Twitter followers
  • LinkedIn® Page: www.linkedin.com
    344,328 employees on LinkedIn®

Who Uses This Product?

  • Who Uses This: Research Assistant, Assistant Professor
  • Top Industries: Higher Education, Research
  • Company Size: 43% Large, 30% Medium

What Do G2 Reviewers Say About IBM SPSS Statistics?

AI-generated summary from verified user reviews

Pros
  • Users appreciate the ease of use in SPSS Statistics, enjoying its intuitive interface for complex analyses.
  • Users praise SPSS Statistics for its ease of use in complex statistical analysis, making data handling straightforward and efficient.
  • Users value the strong data management and cleaning capabilities of IBM SPSS Statistics, enhancing accuracy and efficiency in analyses.
  • Users appreciate the intuitive user interface of IBM SPSS Statistics, simplifying complex analysis and saving time.
  • Users value the robust analysis capabilities of IBM SPSS Statistics, enabling data-driven decisions that enhance credibility in UX work.
Cons
  • Users find the high cost of IBM SPSS Statistics to be a significant barrier for smaller teams.
  • Users find the poor visualization in SPSS Statistics hampers usability and complicates data interpretation for stakeholders.
  • Users find the steep learning curve of IBM SPSS Statistics challenging, especially for those new to statistical analysis.
  • Users find the outdated interface of SPSS unappealing and cumbersome compared to modern data analysis tools.
  • Users often experience performance issues with IBM SPSS Statistics, particularly when handling large datasets, impacting usability.

What Are Recent G2 Reviews of IBM SPSS Statistics?

What Are G2 Users Discussing About IBM SPSS Statistics?

Pure1 AIOps

Pure1 Meta is global intelligence built from a massive collection of storage array health and performance data. By continuously scanning call-home telemetry from Pure’s installed base, Pure1 Meta uses machine learning predictive analytics to help resolve potential issues and optimize your workloads.

Average Rating: 4.7/5.0

Total Reviews: 12

How Do G2 Users Rate Pure1 AIOps?

  • Has the product been a good partner in doing business?: 9.2/10 (Category avg: 8.9/10)
  • AI Text Summarization: 10.0/10 (Category avg: 8.1/10)
  • Algorithms: 10.0/10 (Category avg: 8.6/10)
  • AI Text Generation: 10.0/10 (Category avg: 8.1/10)

Who Is the Company Behind Pure1 AIOps?

  • Seller: Pure Storage
  • Year Founded: 2009
  • HQ Location: Santa Clara, US
  • LinkedIn® Page: www.linkedin.com
    5,173 employees on LinkedIn®
  • Ownership: PSTG
  • Total Revenue (USD mm): $1,359

Who Uses This Product?

  • Company Size: 42% Medium, 33% Large

What Do G2 Reviewers Say About Pure1 AIOps?

AI-generated summary from verified user reviews

Pros
  • Users appreciate the great and fast customer support offered by Pure1 AIOps, enhancing their overall experience.
  • Users appreciate the ease of use of Pure1 AIOps, benefiting from a user-friendly admin console and efficient implementation.
  • Users appreciate the implementation ease of Pure1 AIOps, benefiting from a fully built-out system and user-friendly configurations.
  • Users value the advanced security features of Pure1 AIOps, enhancing their overall safety and confidence in the system.
Cons
  • Users find the higher upfront cost challenging to justify, along with the ongoing hardware subscription fees.
  • Users find the upfront costs and hardware subscription challenging to justify, impacting their overall experience with Pure1 AIOps.

What Are Recent G2 Reviews of Pure1 AIOps?

What Are G2 Users Discussing About Pure1 AIOps?

Alteryx

Alteryx, through it's Alteryx One platform, helps enterprises transform complex, disconnected data into a clean, AI-ready state. Whether you’re creating financial forecasts, analyzing supplier performance, segmenting customer data, analyzing employee retention, or building competitive AI applications from your proprietary data, Alteryx One makes it easy to cleanse, blend, and analyze data to unlock the unique insights that drive impactful decisions. AI-Guided Analytics Alteryx automates and simplifies every stage of data preparation and analysis, from validation and enrichment to predictive analytics and automated insights. Incorporate generative AI directly into your workflows to streamline complex data tasks and generate insights faster. Unmatched flexibility, whether you prefer code-free workflows, natural language commands, or low-code options, Alteryx adapts to your needs. Trusted. Secure. Enterprise-Ready. Alteryx is trusted by over half of the Global 2000 and 19 of the top 20 global banks. With built-in automation, governance, and security, your workflows can scale and maintain compliance while delivering consistent results. And it doesn’t matter if your systems are on-premises, hybrid, or in the cloud; Alteryx fits effortlessly into your infrastructure. Easy to Use. Deeply Connected. What truly sets Alteryx apart is our focus on efficiency and ease of use for analysts and our active community of 700,000 Alteryx users to support you at every step of your journey. With seamless integration to data everywhere including platforms like Databricks, Snowflake, AWS, Google, SAP, and Salesforce, our platform helps unify siloed data and accelerate getting to insights. Visit Alteryx.com for more information, and to start your free trial.

Average Rating: 4.6/5.0

Total Reviews: 863

How Do G2 Users Rate Alteryx?

  • Has the product been a good partner in doing business?: 8.8/10 (Category avg: 8.9/10)
  • AI Text Summarization: 7.2/10 (Category avg: 8.1/10)
  • Algorithms: 8.3/10 (Category avg: 8.6/10)
  • AI Text Generation: 7.0/10 (Category avg: 8.1/10)

Who Is the Company Behind Alteryx?

  • Seller: Alteryx
  • Company Website:
  • Year Founded: 1997
  • HQ Location: Irvine, CA
  • Twitter: @alteryx
    26,149 Twitter followers
  • LinkedIn® Page: www.linkedin.com
    2,312 employees on LinkedIn®

Who Uses This Product?

  • Who Uses This: Data Analyst, Analyst
  • Top Industries: Financial Services, Accounting
  • Company Size: 63% Large, 21% Medium

What Do G2 Reviewers Say About Alteryx?

AI-generated summary from verified user reviews

Pros
  • Users appreciate the ease of use in Alteryx, finding it simple to automate tasks with drag and drop functionality.
  • Users value the automation capabilities of Alteryx, streamlining data processes and enhancing analytical efficiency.
  • Users find Alteryx to be very intuitive, making it easy for non-technical users to learn and utilize.
  • Users find that Alteryx's interface makes learning technology easy for everyone, even those without a tech background.
  • Users value Alteryx for its efficiency in managing data, streamlining workflows, and enhancing overall productivity.
Cons
  • Users highlight the expensive pricing of Alteryx, making it difficult for small teams or startups to afford licenses.
  • Users face a steep learning curve with Alteryx, requiring time to master its complex features.
  • Users find that Alteryx suffers from missing features, such as lack of direct database access and limited reporting tools.
  • Users find the learning difficulty of Alteryx steep, especially for those unfamiliar with RegEx and SQL.
  • Users experience slow performance with Alteryx, particularly when handling large workflows and during data wrangling tasks.

What Are Recent G2 Reviews of Alteryx?

SAP Analytics Cloud

With the SAP Analytics Cloud solution, you can bring together analytics and planning with unique integration to SAP applications and smooth access to heterogenous data sources. As the analytics and planning solution within SAP Business Technology Platform, SAP Analytics Cloud supports trusted insights and integrated planning processes enterprise-wide to help you make decisions without doubt.

Average Rating: 4.2/5.0

Total Reviews: 748

How Do G2 Users Rate SAP Analytics Cloud?

  • Has the product been a good partner in doing business?: 8.3/10 (Category avg: 8.9/10)
  • AI Text Summarization: 8.9/10 (Category avg: 8.1/10)
  • Algorithms: 8.0/10 (Category avg: 8.6/10)
  • AI Text Generation: 8.7/10 (Category avg: 8.1/10)

Who Is the Company Behind SAP Analytics Cloud?

  • Seller: SAP
  • Year Founded: 1972
  • HQ Location: Walldorf
  • Twitter: @SAP
    297,052 Twitter followers
  • LinkedIn® Page: www.linkedin.com
    149,349 employees on LinkedIn®
  • Ownership: NYSE:SAP

Who Uses This Product?

  • Who Uses This: Senior Consultant, Consultant
  • Top Industries: Information Technology and Services, Computer Software
  • Company Size: 49% Large, 28% Medium

What Do G2 Reviewers Say About SAP Analytics Cloud?

AI-generated summary from verified user reviews

Pros
  • Users value the ease of use in SAP Analytics Cloud, simplifying data understanding for everyday tasks and decision-making.
  • Users value the powerful data analysis capabilities of SAP Analytics Cloud for its seamless integration and advanced planning features.
  • Users value the strong visualization capabilities of SAP Analytics Cloud, enhancing data storytelling and stakeholder communication.
  • Users value the powerful integration and predictive modeling capabilities of SAP Analytics Cloud for efficient project management.
  • Users value the easy integrations of SAP Analytics Cloud, allowing seamless connectivity and enhanced collaboration across tools.
Cons
  • Users experience slow performance with large datasets, affecting efficiency and user satisfaction in SAP Analytics Cloud.
  • Users face a steep learning curve in SAP Analytics Cloud that can hinder effective usage without proper training.
  • Users face a steep learning curve with SAP Analytics Cloud, requiring training to navigate its advanced features effectively.
  • Users often face performance issues with SAP Analytics Cloud, particularly when handling large datasets and complex calculations.
  • Users note that handling large datasets can slow down performance, impacting their overall experience with SAP Analytics Cloud.

What Are Recent G2 Reviews of SAP Analytics Cloud?

What Are G2 Users Discussing About SAP Analytics Cloud?

SAP HANA Cloud

SAP HANA Cloud is a modern database-as-a-service (DBaaS) powering the next generation of intelligent data applications. SAP HANA Cloud offers a competitive edge by incorporating advanced machine learning and predictive tools grounded in modern data science. Its powerful in-memory performance safeguards efficient data processing. By securely storing vast amounts of data with its integrated multitier storage and handling various types on a single copy in its native multi-model database, SAP HANA Cloud simplifies data management and connects to other data sources. The seamless integration of these capabilities in a reliable, unified foundation makes it easier for developers to build high-demand intelligent data apps.

Average Rating: 4.3/5.0

Total Reviews: 521

How Do G2 Users Rate SAP HANA Cloud?

  • Has the product been a good partner in doing business?: 8.5/10 (Category avg: 8.9/10)
  • AI Text Summarization: 7.2/10 (Category avg: 8.1/10)
  • Algorithms: 8.8/10 (Category avg: 8.6/10)
  • AI Text Generation: 6.9/10 (Category avg: 8.1/10)

Who Is the Company Behind SAP HANA Cloud?

  • Seller: SAP
  • Year Founded: 1972
  • HQ Location: Walldorf
  • Twitter: @SAP
    297,052 Twitter followers
  • LinkedIn® Page: www.linkedin.com
    149,349 employees on LinkedIn®
  • Ownership: NYSE:SAP

Who Uses This Product?

  • Who Uses This: Consultant, SAP Consultant
  • Top Industries: Information Technology and Services, Computer Software
  • Company Size: 61% Large, 26% Medium

What Do G2 Reviewers Say About SAP HANA Cloud?

AI-generated summary from verified user reviews

Pros
  • Users appreciate the exceptional ease of use of SAP HANA Cloud, contributing to improved decision-making and collaboration.
  • Users appreciate the easy integrations of SAP HANA Cloud, enhancing data management and reporting efficiency seamlessly.
  • Users appreciate the seamless integration capabilities of SAP HANA Cloud, enhancing data management and reporting efficiencies.
  • Users praise SAP HANA Cloud for its exceptional real-time performance, enhancing usability and driving significant business value.
  • Users commend the scalability of SAP HANA Cloud, enabling flexibility and efficiency in managing large, complex datasets.
Cons
  • Users often struggle with the complexity of setup and configuration, making it challenging for new users to navigate.
  • Users feel that the cost can be prohibitive for smaller organizations, particularly with premium features and usage growth.
  • Users note a steep learning curve for SAP HANA Cloud, which may require specialized training to navigate effectively.
  • Users find the difficult learning curve of SAP HANA Cloud challenging, particularly for those new to SAP technologies.
  • Users point out the complex setup of SAP HANA Cloud, which can be challenging for specialized applications and users.

What Are Recent G2 Reviews of SAP HANA Cloud?

Amazon Forecast

Amazon Forecast is a fully managed service that uses machine learning to deliver highly accurate forecasts.

Average Rating: 4.3/5.0

Total Reviews: 102

How Do G2 Users Rate Amazon Forecast?

  • Has the product been a good partner in doing business?: 8.9/10 (Category avg: 8.9/10)
  • AI Text Summarization: 8.8/10 (Category avg: 8.1/10)
  • Algorithms: 8.7/10 (Category avg: 8.6/10)
  • AI Text Generation: 9.6/10 (Category avg: 8.1/10)

Who Is the Company Behind Amazon Forecast?

  • Seller: Amazon Web Services (AWS)
  • Year Founded: 2006
  • HQ Location: Seattle, WA
  • Twitter: @awscloud
    2,232,483 Twitter followers
  • LinkedIn® Page: www.linkedin.com
    147,094 employees on LinkedIn®
  • Ownership: NASDAQ: AMZN

Who Uses This Product?

  • Top Industries: Computer Software, Information Technology and Services
  • Company Size: 49% Small, 37% Medium

What Do G2 Reviewers Say About Amazon Forecast?

AI-generated summary from verified user reviews

Pros
  • Users find Amazon Forecast to be user-friendly, offering accurate predictions without requiring machine learning expertise.
  • Users value the high forecasting accuracy of Amazon Forecast, leveraging advanced ML to produce dependable predictions effortlessly.
  • Users value the high accuracy of Amazon Forecast, benefiting from reliable results through advanced machine learning technology.
  • Users appreciate the high accuracy and ease of use of Amazon Forecast, leveraging advanced ML for reliable predictions.
  • Users value the high accuracy of Amazon Forecast, benefiting from reliable results powered by advanced ML technology.
Cons
  • Users express concern over the high costs of Amazon Forecast, particularly with large datasets and frequent predictions.
  • Users find Amazon Forecast's complexity in setup and use frustrating, particularly affecting those unfamiliar with AWS services.
  • Users find the steep learning curve of Amazon Forecast challenging, especially for those not familiar with AWS.
  • Users express concern over the high costs of Amazon Forecast, especially when scaling for larger datasets.
  • Users find that the cost escalates quickly with large datasets and frequent model retraining, impacting budget management.

What Are Recent G2 Reviews of Amazon Forecast?

Dataiku

Dataiku is the Platform for AI Success: the AI orchestration layer where enterprises build, deploy, and govern analytics, models, and agents at scale. It sits on top of the data platforms, clouds, and AI services you already use, working across all of them without locking you into any one. Dataiku expands who can build production AI, putting the right tools in the hands of data scientists and domain experts alike, from fraud analysts to demand planners. It orchestrates machine learning, rules, LLMs, and agents as one governed system, built on more than a decade of running production AI. Governance is part of the build rather than something bolted on afterward, so teams ship faster while keeping performance, cost, and risk under control. The result: AI that moves from experimentation to trusted, measurable execution now, not in 18 months.

Average Rating: 4.4/5.0

Total Reviews: 218

How Do G2 Users Rate Dataiku?

  • Has the product been a good partner in doing business?: 8.6/10 (Category avg: 8.9/10)
  • AI Text Summarization: 8.3/10 (Category avg: 8.1/10)
  • Algorithms: 8.1/10 (Category avg: 8.6/10)
  • AI Text Generation: 8.7/10 (Category avg: 8.1/10)

Who Is the Company Behind Dataiku?

  • Seller: Dataiku
  • Company Website:
  • Year Founded: 2013
  • HQ Location: New York, NY
  • Twitter: @dataiku
    22,917 Twitter followers
  • LinkedIn® Page: www.linkedin.com
    1,605 employees on LinkedIn®

Who Uses This Product?

  • Who Uses This: Data Scientist, Data Analyst
  • Top Industries: Financial Services, Pharmaceuticals
  • Company Size: 59% Large, 23% Medium

What Do G2 Reviewers Say About Dataiku?

AI-generated summary from verified user reviews

Pros
  • Users find Dataiku easy to use, simplifying ML development and helping detect opportunities and risks effortlessly.
  • Users appreciate how Dataiku simplifies ML development, enabling quick training, evaluation, and understanding of data easily.
  • Users value the ease of use in Dataiku, enabling collaboration and simplifying complex data processes for all skill levels.
  • Users appreciate the easy integrations of Dataiku, facilitating collaboration across diverse analytics tools and skill sets.
  • Users commend the productivity improvement brought by Dataiku’s visual recipes and robust tools for analytics projects.
Cons
  • Users find the learning curve steep, making it challenging for beginners to fully utilize Dataiku's advanced features.
  • Users find the steep learning curve challenging, especially for beginners navigating Dataiku's advanced features.
  • Users face slow performance with Dataiku when managing large datasets, impacting efficiency and productivity.
  • Users find the difficult learning curve challenging for beginners, impacting their ability to maximize the platform's potential.
  • Users find the pricing high for small companies and students, impacting accessibility for basic projects.

What Are Recent G2 Reviews of Dataiku?

What Are G2 Users Discussing About Dataiku?

Nixtla

TimeGPT is a cutting-edge foundation model specifically designed for time series forecasting and anomaly detection. This innovative solution empowers users to harness the full potential of their time series data, enabling more informed decision-making across various domains. With its advanced capabilities, TimeGPT stands out as a pivotal tool for organizations looking to optimize their data-driven strategies. Targeted at data scientists, analysts, and business decision-makers, TimeGPT caters to a wide range of industries, including finance, energy, and meteorology. Its ability to process and analyze vast amounts of time series data makes it an invaluable resource for those seeking to improve operational efficiency, enhance predictive accuracy, and identify unusual patterns that may indicate underlying issues. Whether it’s forecasting stock prices, predicting energy consumption, or analyzing weather trends, TimeGPT provides the necessary tools to tackle complex time series challenges. One of the key features of TimeGPT is its zero-shot inference capability, which allows users to generate forecasts and detect anomalies without the need for prior training data. This feature significantly reduces the time and resources typically required for model training, enabling users to quickly gain insights from their data. Additionally, TimeGPT has been extensively trained on over 100 billion time series data points, ensuring that it can deliver reliable and accurate predictions across various contexts. TimeGPT also offers fine-tuning options, allowing users to adapt the model to their specific datasets. This flexibility ensures that organizations can tailor the model to their unique time series characteristics, enhancing its predictive performance. Furthermore, the model supports the integration of exogenous variables, which can improve forecast accuracy by accounting for external factors that may influence the data. With robust API access, TimeGPT can be seamlessly integrated into existing applications, making it easy for organizations to leverage its capabilities. It is also compatible with Azure Studio and can be deployed on private infrastructure, providing users with the flexibility to choose the deployment method that best suits their needs. The ability to forecast multiple time series simultaneously further optimizes workflows, allowing organizations to manage resources effectively while enhancing their analytical capabilities. In addition to its forecasting prowess, TimeGPT excels in anomaly detection, automatically identifying unusual patterns in time series data. This feature is particularly beneficial for organizations that need to monitor systems in real-time and respond swiftly to potential issues. By incorporating exogenous features, users can further enhance the model's performance, ensuring that they are equipped to handle the complexities of their time series data.

Average Rating: 4.7/5.0

Total Reviews: 51

How Do G2 Users Rate Nixtla?

  • Has the product been a good partner in doing business?: 9.4/10 (Category avg: 8.9/10)
  • AI Text Summarization: 4.3/10 (Category avg: 8.1/10)
  • Algorithms: 9.6/10 (Category avg: 8.6/10)
  • AI Text Generation: 4.6/10 (Category avg: 8.1/10)

Who Is the Company Behind Nixtla?

  • Seller: Nixtla
  • Company Website:
  • Year Founded: 2021
  • HQ Location: San Francisco, US
  • LinkedIn® Page: www.linkedin.com
    38 employees on LinkedIn®

Who Uses This Product?

  • Who Uses This: Data Scientist
  • Top Industries: Computer Software, Retail
  • Company Size: 43% Large, 39% Small

What Do G2 Reviewers Say About Nixtla?

AI-generated summary from verified user reviews

Pros
  • Users highly value the ease of use of Nixtla, benefiting from seamless integration and efficient forecasting capabilities.
  • Users appreciate the easy integrations of Nixtla's libraries, enhancing efficiency in their forecasting workflows.
  • Users commend Nixtla for their responsive customer support, making it easy to resolve issues and gain insights.
  • Users value the adaptability and accuracy of TimeGPT in predicting time series for environmental applications.
  • Users appreciate the implementation ease of Nixtla, enjoying seamless integration across diverse forecasting models.
Cons
  • Users note the absence of key features in Nixtla, hindering functionality and usability for complex forecasting tasks.
  • Users find Nixtla quite expensive, especially for smaller companies with non-critical forecasting needs.
  • Users often struggle with the lack of guidance in documentation for advanced use cases, hindering their experience.
  • Users note the limited features of Nixtla, impacting geospatial support and forecast interpretability.
  • Users find the learning curve challenging, as improvements in documentation and examples would enhance usability significantly.

What Are Recent G2 Reviews of Nixtla?

Bijou Barry
BB
Researched and written by Bijou Barry
Updated October 29, 2024

Learn More About Predictive Analytics Software

What are predictive analytics tools and software?

Predictive analytics software is all about making business outcomes predictable. Data scientists and data analysts can do this by using data mining and predictive modeling to analyze historical data. By better understanding the past, businesses can gain insights into the future. Predictive analytics is a step further than general business intelligence, which companies use to pull actionable insights from their data sets. Instead, users can develop machine learning algorithms and predictive models to help forecast and achieve business-critical numbers.

The reason businesses can hit those critical numbers and become more predictive is due to the boom of big data. Companies can harness their data like never before. By recording and owning more and more historical and real-time data, data scientists have larger sample sizes to work with, meaning they can be much more accurate. Additionally, companies investing in predictive analytics without ensuring that their data is accurate, clean, and accessible will ultimately be wasting their time. However, those who can wrangle their data properly will create a significant competitive edge and hold an advantage in the market.

Benefits of using predictive analytics tools

  • Accurately predict and forecast revenue numbers based on a wide range of variables
  • Understand and account for customer churn and retention
  • Predict employee churn based on historical factors for turnover
  • Make more precise, data-driven decisions in all departments based on available data
  • Determine both risks and opportunities that were otherwise hidden within company data

Why use predictive analytics solutions?

There are a number of applications for predictive analytics software and reasons businesses should adopt them, but they all boil down to understanding what has happened in the past, what could happen in the future, and what should be done to ensure positive business outcomes. These are considered descriptive analytics, predictive analytics, and prescriptive analytics.

Descriptive Analytics (understanding the past) — Descriptive analytics deals with understanding what has happened in the past and how it has influenced where a business is in the present. This means undergoing data mining on a company’s historical data. This type of analysis can be obtained by using business intelligence tools, big data analytics, or time-series data. Regardless of how it is attained, providing descriptive analytics is a key foundation of predictive analytics and creating data-driven decision-making processes. It requires thorough data preparation and organizing the data for easy descriptive analysis.

Predictive Analytics (knowing what is possible) — Predictive analytics allows users and businesses to know and anticipate potential outcomes. Building predictive models based on descriptive analysis can ensure that businesses do not make the same mistake twice. It can also provide more accurate forecasting and planning, which helps to optimize efficiency. Ultimately, this analysis makes the unknown known.

Prescriptive Analytics (so now what?) — The final step and ultimate reason for using predictive analytics tools is to make clear actions based on the suggestions and recommendations of the predictive models. This is where machine learning and deep learning functionality come into play. Some predictive analytics solutions can provide actionable insights without human intervention. For example, it can provide a short list of sales accounts that should close quickly based on several variables. Becoming prescriptive takes analytics a step further and is the ultimate reason for adopting advanced, predictive analytics.

Who uses predictive analytics platforms?

To fully take advantage of predictive analytics platforms, businesses need to hire highly skilled data scientists with knowledge in machine learning development and predictive modeling. These skilled workers are not abundant, so they are often paid very well. Dedicating financial resources to these positions may not be an option for every company, but those who can afford data scientists have a leg up on the competition.

While data scientists or data analysts are the employees tasked with using predictive analytics software, there are many industries and departments that can be impacted by using predictive analytics:

Manufacturing and Supply Chain—One area that can be greatly enhanced by using predictive analysis is demand planning for manufacturing companies. With more accurate forecasting, businesses can avoid risks like shortages and surpluses. Additionally, companies can become predictive about quality management and production issues. By analyzing what has caused production failures in the past, companies can anticipate and avoid production breakdowns in the future.

Distribution is another major aspect of the supply chain that can be further optimized with predictive modeling. By better estimating where goods will need to be delivered and the risks that may hold up distribution modes, businesses can provide better service and more efficiently deliver their products to customers. Taking into account historical data, such as weather, traffic, and accident records, shipping can become a more precise science.

Retail — Retail is another industry that is ripe for optimization with the help of predictive analytics. Retail predictive analytics can provide businesses with insights on everything from pricing optimization to understanding how shoppers navigate brick-and-mortar stores for better in-store organization of merchandise. E-commerce businesses can track these factors in a much more efficient manner. All e-commerce interactions can be recorded into a database and influenced by predictive models. This is one of the main reasons Amazon has been so successful and disruptive to brick-and-mortar retailers. Every decision can be made predictive with the help of data.

Marketing and Sales — Being able to predict the actions of customers and prospects is an invaluable service for any business. Marketing teams can leverage predictive analytics software to project how marketing campaigns may perform, which segment of prospects to target with ads, and the potential conversion rates of each campaign. Understanding how these efforts impact the bottom line is critical to the success of marketing teams and translates into a much more efficient and productive sales team. At the same time, sales teams can leverage predictive modeling in such areas as lead scoring, determining which accounts to target first because they have a higher chance of closing. Ensuring that sales representatives are working smarter instead of harder means more revenue. A few CRM and marketing automation solutions provide some level of predictive functionality, but data scientists can separately funnel that data into dedicated predictive analytics tools to find cross-departmental correlations.

Financial Services—The banking industry has long been ripe for disruption, but financial administrations are using predictive analytics solutions to better predict risk. Historical data can power predictive analytics software to predict fraudulent transactions and determine credit risks, among other functions.

Types of predictive analytics software

Predictive modeling is a complex science that requires years of training to understand. There is a reason data scientists are in high demand: not many people have a complete grasp of how to build predictive models. There are two main types of predictive models: classification and regression models.

Classification Models—Simply put, classification puts a piece of data into a bucket or a class and labels it as such. Classification models essentially label data based on what an algorithm has already learned. The ultimate goal of classification models is to accurately bucket new data points into the proper classes so that the data can become predictive and prescriptive.

Regression Models—Regression models analyze the relationship between two separate data points and help forecast what happens when they are placed side by side. For example, in baseball, teams may perform a regression analysis on the relationship between the number of fastballs thrown and the number of home runs hit.

Decision Trees — One common type of classification model is a decision tree. These models predict several possible outcomes based on a variety of inputs. For example, if a sales team builds $1 million in a pipeline, they can close $100,000 in revenue, but if they create $10 million in a pipeline, they should be able to close $1 million in revenue.

Neural Networks—Neural networks, known in the AI world as artificial neural networks, are extremely complex predictive models. These models can predict and analyze unstructured, nonlinear relationships between data points. These solutions provide pattern recognition and can help track anomalies. Artificial neural networks were originally created and built to mimic the synapses and neural aspects of the human brain. They are one of the contributing factors to the accelerated growth in artificial intelligence and deep learning.

Other types of predictive modeling include Bayesian analysis, memory-based reasoning, k-nearest neighbor, support vector machines, and time-series data mining.

Potential issues with predictive analytics software solutions

Lack of Skilled Employees—The main issue with adopting predictive analytics software is the need for a skilled data scientist to interact with the data and build the models. There is a distinct skill gap in terms of finding users who understand how to pull data and build models and the implications that the data has on the overall business. For this reason, data scientists are in very high demand and, thus, expensive.

Data Organization—Many companies face the challenge of organizing data so that it can be easily accessed. Harnessing big data sets that contain historical and real-time data is not easy in today's world. Companies often need to build a data warehouse or a data lake that can combine all the disparate data sources for easy access. This, again, requires highly knowledgeable employees.